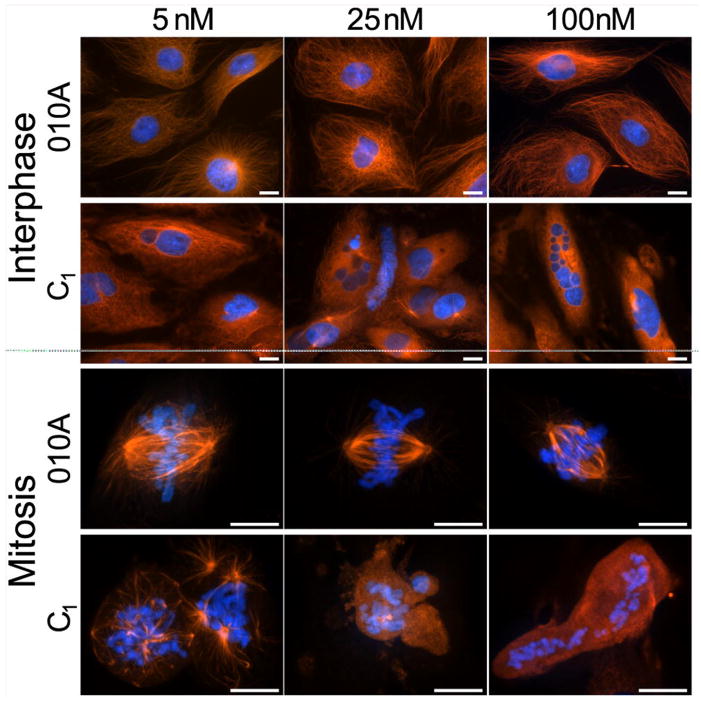
Figure 4. Disorazole C1 disrupts microtubules at interphase and metaphase.
Mammalian PtK2 cells were treated with the indicated concentrations of either O1OA (inactive analog of disorazole C1) or disorazole C1 for 24 h at 37°C. Cells were fixed and stained with anti-α-tubulin antibody to visualize microtubules (red) and Hoechst 33342 to visualize chromosomes (blue). All images were collected with a Nikon E600 microscope equipped with a Roper CoolSnap HQ digital camera at 40X (interphase) or 100X objectives (mitotic spindles). Upper panels, interphase; lower panels, mitosis. Bars = 10 μm.

