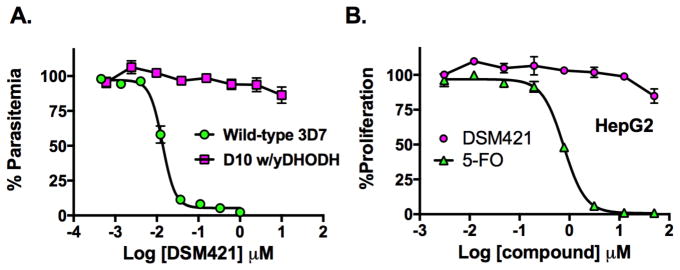
Figure 3.
P. falciparum and mammalian cell growth inhibition by DSM421. A. Dose response of DSM421 versus P. falciparum 3D7 cells EC50 = 0.014 (0.013 – 0.015) μM and on D10 cells transfected with yeast DHODH (EC50 > 10 μM). B. Dose response of DSM421 (EC50 > 50 μM) and 5-fluoroorotate (EC50 = 0.77 (0.71 – 0.83) μM versus Human HepG2 cells. Data in A and B were fitted in GraphPad Prism to log(inhibitor) vs. response – Variable slope (four parameter) fit equation to determine the EC50 (data in parenthesis show the 95% confidence interval for the fit). Triplicate data were collected per concentration point and error represents the standard deviation of the mean.

