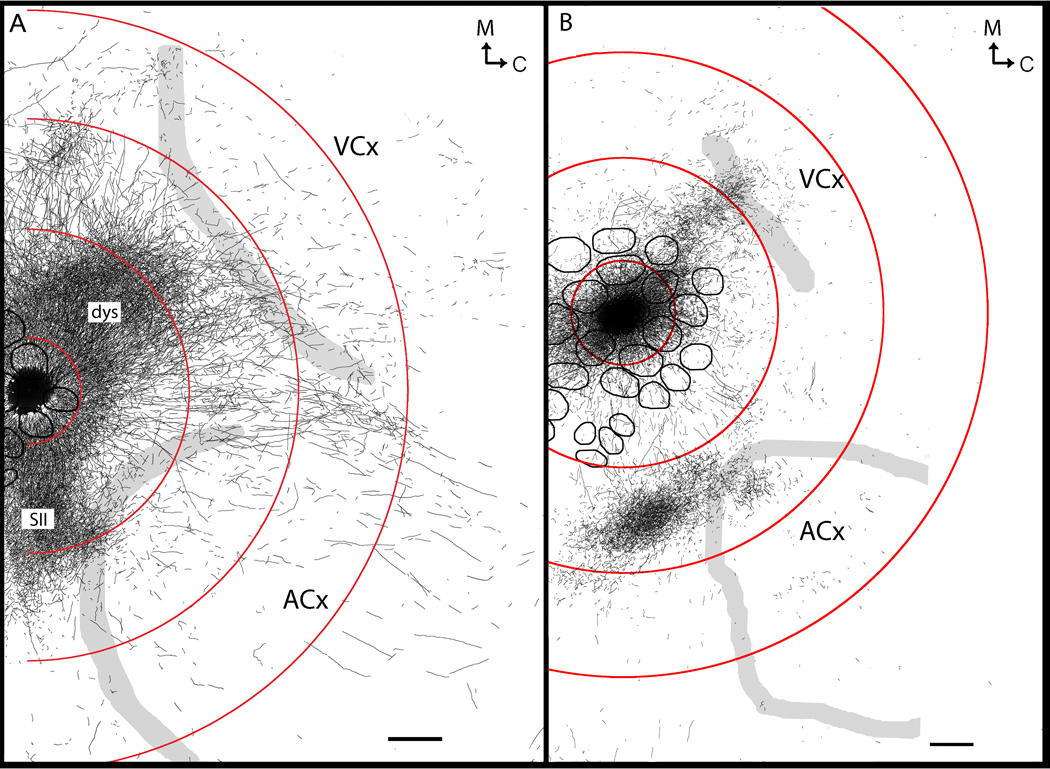
Figure 5. Examples of border-crossing, long-range horizontal connections following BDA injections localized above A2 (A), C2 (B) barrels including part of their surrounding septa.
Axons outlined were overlapped from 4 consecutive, 30 µm flattened brain slices of layers 2–3 (A) or from 4 consecutive slices from layers 2–3 and one of layer 5 (B) and superimposed on a layer IV scheme obtained from the same animal, showing barrels (black or grey small ellipses), and cortical borders (grey). Axons are shown relative to circles centered at the respective barrel and are similar to those shown in Fig. 2. Circles were extrapolated based on percentage of rats with evoked SU at a given distance − 100% (smallest circle, = small dashed in Figure 2); >50% (second smallest, = medium, solid in Fig. 2); and farthest electrode with measurable SU (second largest, = large, dashed in Fig. 2). Extrapolated largest circle is based on 100% of rats exhibiting evoked LFP at the farthest location (yellow, solid in Fig. 2). Scale bars = 500 µm.

