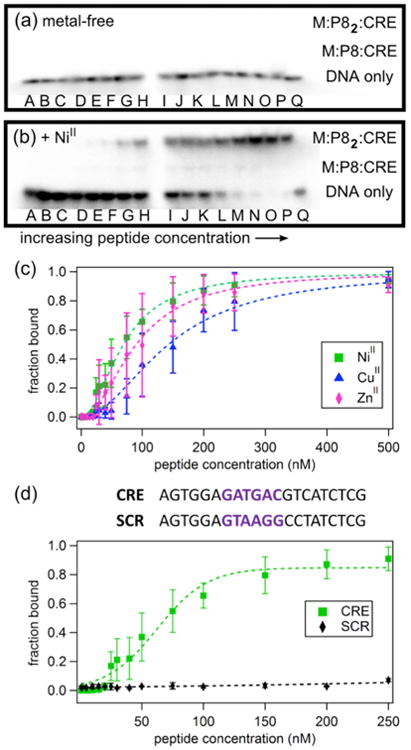
Figure 6.

Electrophoretic mobility shift assay for monitoring P8-CRE binding in the absence (a) and the presence (b) of 0.5 equiv. of NiII. Lane Q contains CRE without any added peptide; DNA concentration is kept constant at 1 nM while the P8 concentrations varies: (A) 1 nM, (B) 2 nM, (C) 5 nM, (D) 10 nM, (E) 15 nM, (F) 20 nM, (G) 25 nM, (H) 30 nM, (I) 40 nM, (J) 50 nM, (K) 75 nM, (L) 100 nM, (M) 150 nM, (N) 200 nM, (O) 250 nM, (P) 500 nM. The intensities of the radioactively labelled CRE bands were measured by phosphorimaging. (c) Effects of different metal ions (0.5 equiv.) on CRE binding by P8, determined by electrophoretic mobility shift assays. See Fig. S23-S24 for additional data. (d) DNA sequence specificity of P8 binding.
