Figure 1.

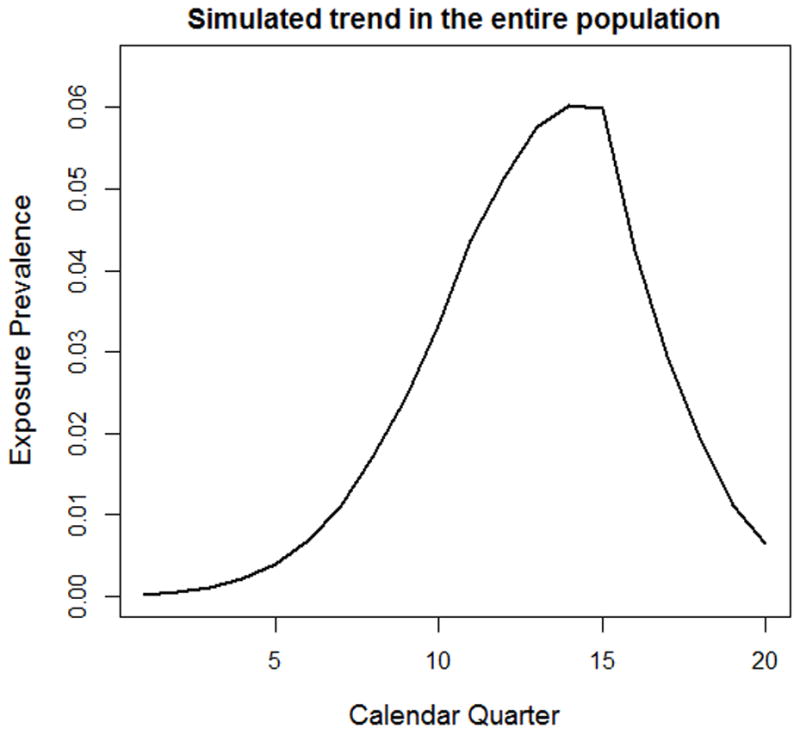
Trend of simulated exposure over 20 calendar quarters. The exposure prevalence goes from 0% in the first quarter to 5% in the 15th quarter and then goes down to almost 0% in the 20th quarter.

Trend of simulated exposure over 20 calendar quarters. The exposure prevalence goes from 0% in the first quarter to 5% in the 15th quarter and then goes down to almost 0% in the 20th quarter.