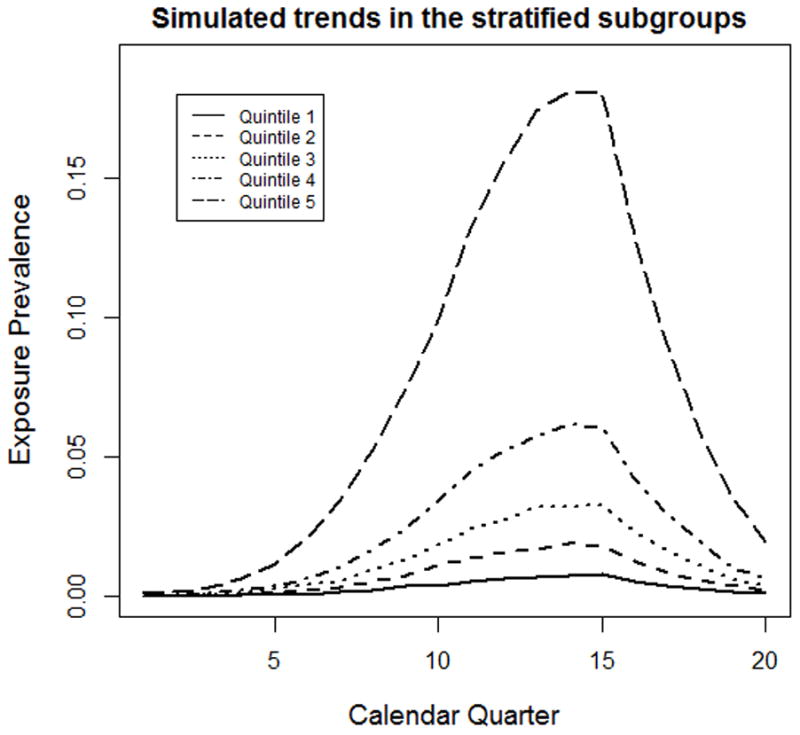
Figure 2.

Simulated trends in exposure prevalence for the stratified subgroups based on cumulative probability of exposure quintiles. Each quintile of cumulative probability of exposure exhibits a different trend of exposure prevalence over time. The top quintile has the most dramatic change from base level to peak while the bottom quintile barely changes.
