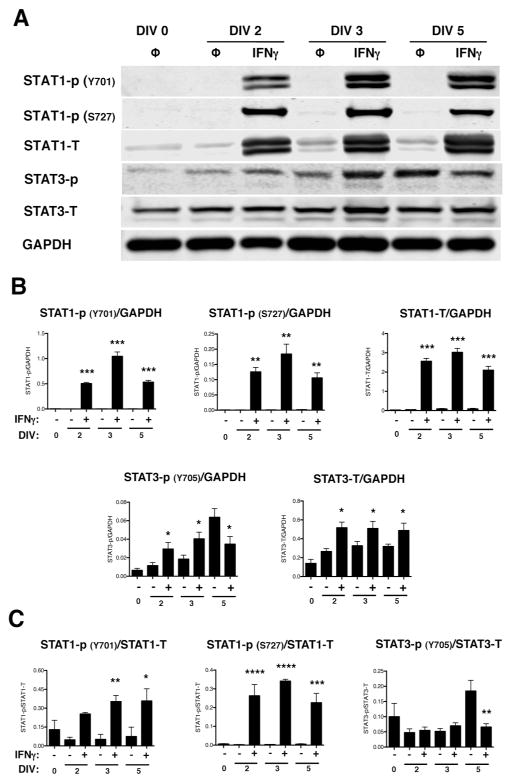
Figure 4. NSPCs activate STAT1 and STAT3 upon IFNγ stimulation.
IFNγ-treated NSPCs (100U/ml) were collected on DIV 2, 3, and 5, and lysed for western blot analysis. (A) Representative blots are shown for phosphorylated STAT1 (Y701 and S727), total STAT1, phosphorylated STAT3 (Y705), and total STAT3. GAPDH is shown as the loading control. (B) The fluorescence signal for each protein was quantified and normalized to GAPDH. (C) For the phosphorylated STAT1 and STAT3 bands, the fluorescence signals were also normalized to the levels of the total STAT1 and STAT3, respectively. The average of 3–5 biological replicates is plotted with SEM. Statistical analysis was applied using repeated measures one-way ANOVA with Bonferroni multiple comparisons post-hoc analysis (****p<0.0001, *** p<0.001, ** p<0.01 *p<0.5).

