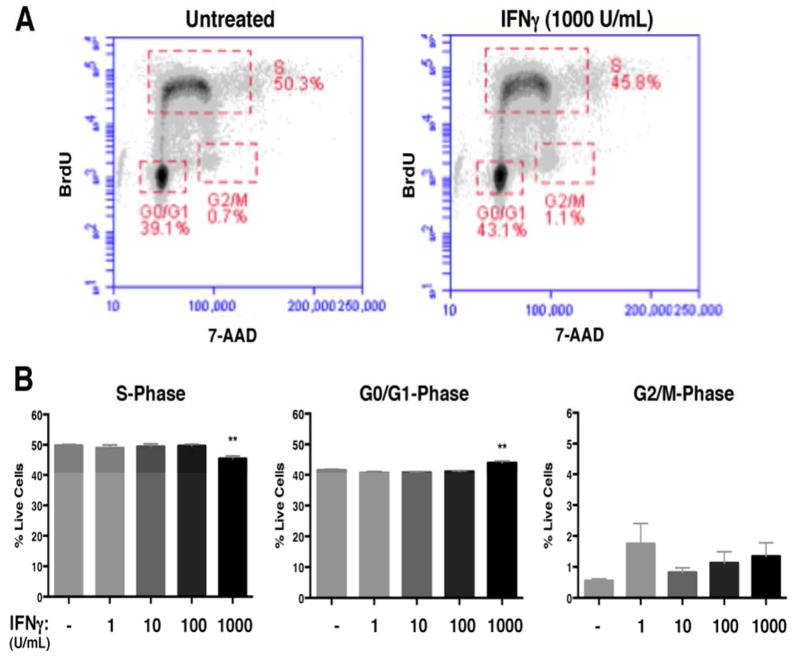
Figure 7. IFNγ-mediated regulation of cell cycle progression is STAT1-dependent in NSPCs.
(A) STAT1-KO NSPCs were treated with IFNγ (1, 100, 1000 U/ml) for 72h and labeled with BrdU and 7-AAD. The BrdU and 7-AAD intensities per cell were assayed by flow cytometry. Cell populations were gated in different phases of cell cycle (S = synthesis phase, G1= gap phase 1, M= mitosis phase, G2= gap phase 2). Representative plots for untreated and IFNγ-treated NSPCs (1000 U/ml) are shown. (B) Quantitation of NSPCs in each cell cycle phase. The average percentage of cells in each cell cycle phase was plotted with SEM (n=3). Statistical analysis was applied using one-way ANOVA (** p<0.01).

