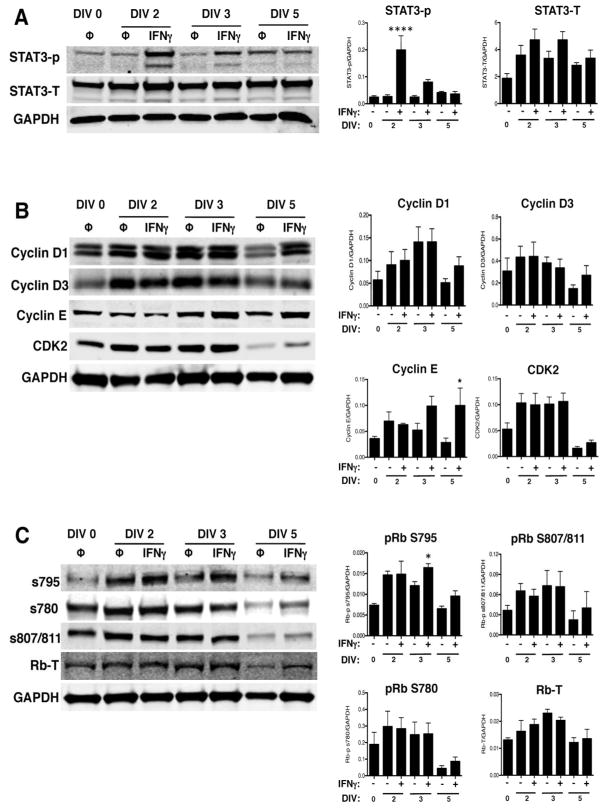
Figure 8. IFNγ activates STAT3, but does not inhibit cyclin E expression or pRb phosphorylation at S795, in the absence of STAT1.
STAT1-KO NSPCs were treated with IFNγ (100U/ml) and collected on DIV 2, 3, and 5 for western blot analysis. Representative blots for phosphorylated and total STAT3 (A); cyclins D1, D2, D3, E and cdk2, (B); and for total pRb and associated pRb phosphorylation sites (C) are shown. Signal intensity for each band was normalized to GAPDH as a loading control. Quantitation of signal intensity is shown as the average from 3 independent biological replicates with SEM. Statistical analysis was applied using repeated measures one-way ANOVA with Bonferroni multiple comparisons posthoc analysis (*p<0.5, **** p<0.0001).

