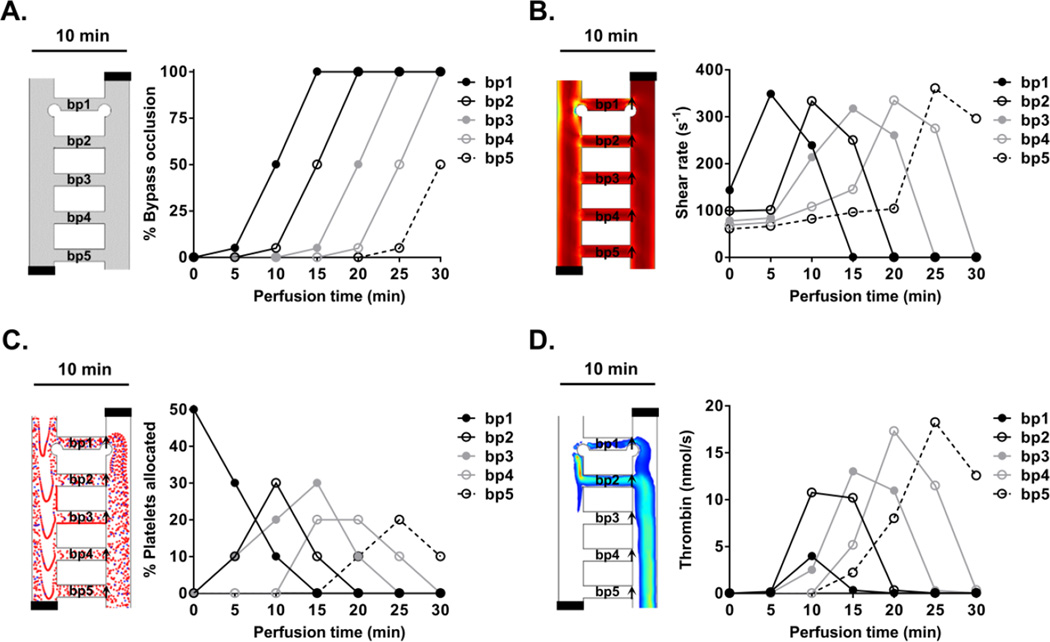
Figure 4. Prediction of the effect of thrombus formation within a ladder network.
Computer simulations of the effects of thrombus formation on the dynamics of blood flow dynamics were performed at discrete time and bypass-to-bypass locations (A). The changes in shear profile (B; s−1), platelet distribution profile (C) and concentration profile of thrombin (D; nmol/s) at each bypass were calculated as a function of time. Arrows indicate regions of measurement integration.

