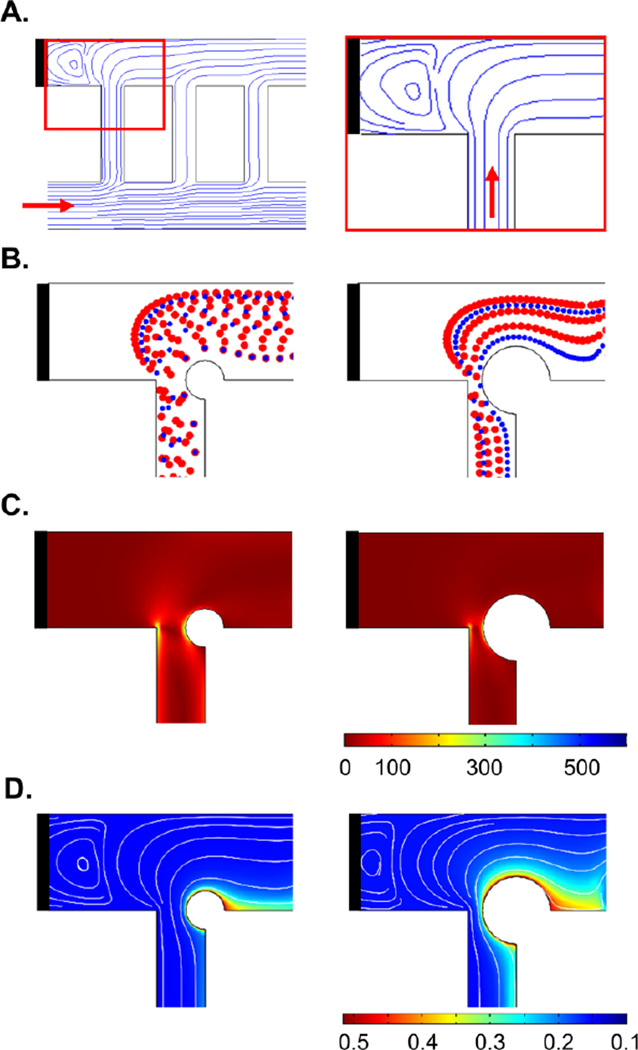
Figure 5. Prediction of the effect of the flow recirculation on platelet aggregation and fibrin formation.
Computer simulation of the streamlines of the bulk blood flow through the network ladder predicts a flow distortions at the intersection of the first bypass (bp 1; resulting in a zone of recirculation), at the stoppered channel (black bar), and at channel 2 (A). Simulation of blood cell transport during thrombus formation: < 50% of bypass obstruction, left, and > 50% bypass obstruction, right (B); shear rate profile (C) and thrombin convection profile mol/m3 (D) within these regions.

