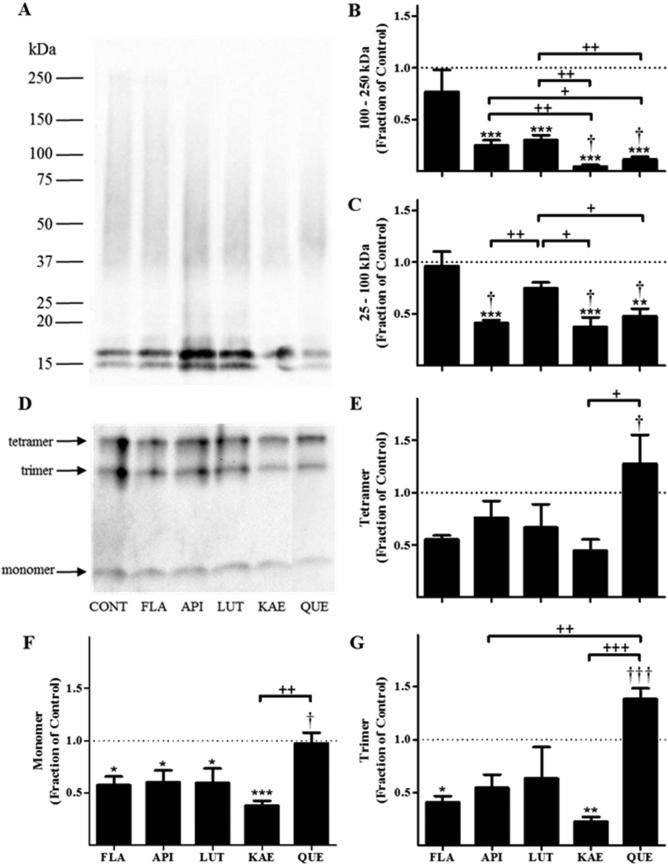
Figure 2. Hydroxylated anthoxanthins alter Aβ oligomer size distribution.
Oligomers were prepared from Aβ1-42 (15 μM) in the absence (CONT, control) or presence of 150 μM anthoxanthins flavone (FLA), apigenin (API), luteolin (LUT), kaempferol (KAE), or quercetin (QUE) by dilution from DMSO into 12 mM phosphate (pH 7.4) containing 1 μM NaCl. Following oligomerization (30 min, 25°C), oligomers were stabilized via addition of Tween-20 (0.1%), resolved by SDS-PAGE on either a 4-20% Tris-glycine gel (panel A) or a 16.5% Tris-tricine gel (panel D), transferred to nitrocellulose membrane, and probed with 6E10 antibody. Images are representative of 3-5 independent experiments. Using volumetric analysis in conjunction with the 4-20% Tris-glycine gel images (panel A), oligomer species within size ranges of 100-250 kDa (panel B) and 25-100 kDa (panel C) were quantified. Using band intensity analysis in conjunction with the 16.5% Tris-tricine gel images (panel D), tetramer (panel E), trimer (panel G), and monomer (panel F) species were quantified. Reported results are normalized to the control, shown as a dashed line with a value of 1 and representing no change. Error bars indicate SEM, n=3-5. *p<0.05, **p<0.01, and ***p<0.001 versus control; †p<0.05 and †††p<0.001 versus flavone; +p<0.05, ++p<0.01, and +++p<0.001 between samples.

