
Fig. 9.
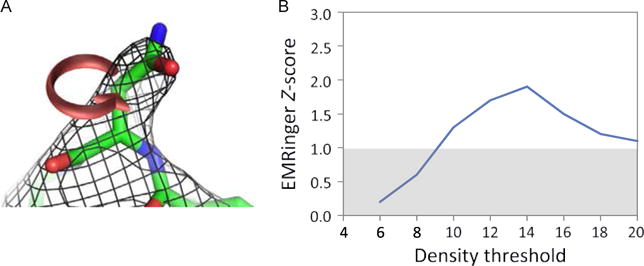
(A) A schematic of the use of EMRinger for model validation (Barad et al., 2015). Given a backbone model and a density map, EMRinger considers all possible positions for a putative Cγ and identifies density peaks at a given threshold; the fractions of these peaks over the whole structure, which are rotameric are used to assess the quality of the model. (B) The results of EMRinger analysis on a sample system: the x-axis plots various density value cutoffs and the y-axis shows the EMRinger Z-score. Higher values are better, with Z-score of >2 indicating high-quality structures. These figures are reproduced from Barad, B. A., Echols, N., Wang, R. Y., Cheng, Y., DiMaio, F., Adams, P. D., et al. (2015). EMRinger: Side chain-directed model and map validation for 3D cryo-electron microscopy. Nature Methods, 12, 943–946.