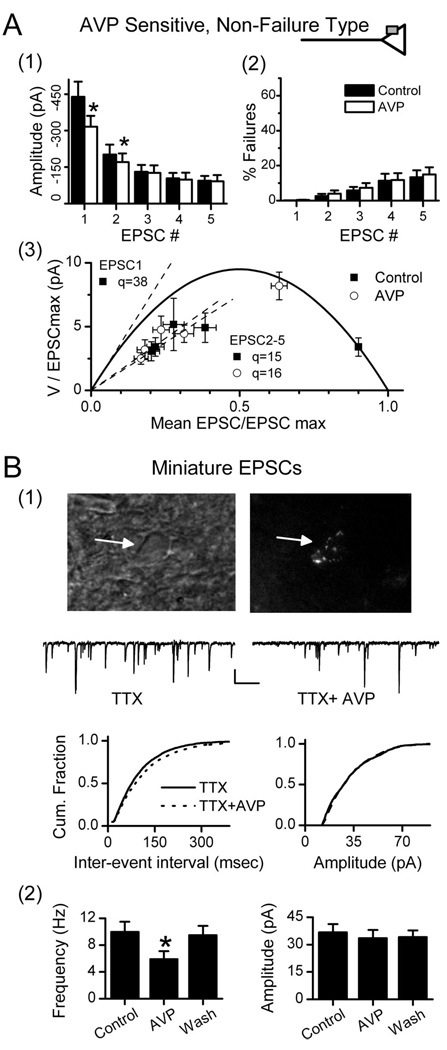
Figure 5.
AVP reduces release probability at ST–NTS synapses: intraterminal mode. ST-EPSC characteristics for AVP-sensitive, non-failure-type (A) and AVP-sensitive miniature EPSCs on second-order neurons (B). In control histograms (A1, filled bars), frequency-dependent depression decreased amplitude >50% (5 ST shocks at 20 ms intervals). AVP (open bars) significantly reduced (*p < 0.05) amplitudes of both EPSC1 and EPSC2, whereas EPSC3–5 values were unchanged. Synaptic failure rates (A2) were low but increased as the ST burst progressed to an EPSC5 failure rate of <20%. AVP did not alter failure rate. The group V–M relationship for AVP-sensitive neurons (A3; n=20) used a p value of 90% for EPSC1 in 2mm Ca 2+as assessed in separate studies (Fig. 3). V–M values for EPSC1 in AVP closely followed the parabolic model with decreased M and increased V. EPSC2–5 did not lie on the V–M parabola and AVP did not alter their linear V–M fits (dashed lines). The apparently decreased quantal size likely results from frequency-dependent depletion. In control conditions, q of EPSC1 is predicted by the V–M parabola, initial slope as 38 pA. AVP did not change q for EPSC2–5 ( p > 0.05). B, To better discriminate potential presynaptic from potential postsynaptic AVP actions, miniature EPSCs (mEPSCs) were recorded in TTX (2µm) in identified second-order NTS neurons. B1, A representative second-order medial NTS neuron was identified by its latency (6.1 ms) and jitter (86µs) and by the presence of parasomatic, fluorescent baroreceptor terminals. The top left micrograph is an infrared DIC image of the neuron (arrow), and the top right is the same field of view under fluorescence showing parasomatic dye-positive puncta from ADN afferent contacts. Representative current traces in TTX from this same neuron (middle traces) show that AVP (3µm) rapidly and reversibly reduced mEPSC frequency. AVP significantly shifted cumulative (Cum.) mEPSC frequencies to longer interevent intervals (bottom left), but the amplitude distribution (bottom right) was unchanged (Kolmogorov–Smirnov test; control, 327 events; AVP, 216 events). B2, Group averages for similarly tested second-order NTS neurons (n=4). AVP decreased mean frequency (left), but mEPSC amplitudes were unchanged (right). Wash reversed these changes. Three additional second-order NTS neurons were tested and found to be AVP insensitive (data not shown). Results are consistent with AVP selectively acting at a presynaptic target to reduce glutamate release onto the AVP-sensitive second-order NTS neurons

