Figure 1.
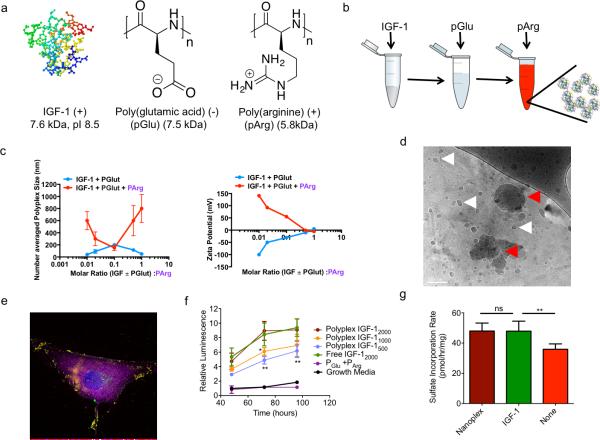
Characterization of IGF-1 containing nanoplex. (a) Structures and properties of polyelectrolyte materials used in the study (b) Schematic for generating IGF-1 nanoplex materials. (c) Size and zeta potential as a function of polyelectrolyte molar ratios. (d) cryo-TEM image of the generated IGF-1 nanoplex. The white arrows indicate the location of a nanoplex and red arrows indicate nanoplex aggregates (scale bar: 100nm) (e) Colocalization of the IGF-1 nanoplex with CHON-001 cells. The nucleus (blue), membrane (magenta), pArg (red), and IGF-1 (green) have been stained. Yellow shows assembled nanoplex. (f) Bioactivity of IGF-1 as measured by BrdU proliferation assay of CHON-001 cells (n = 6 per condition, **p < 0.01, *p < 0.05) (g) Rate of cartilage tissue sulfate incorporation in response to treatment with 20 uM nanoplex, 20 uM IGF-1 alone, or no treatment added to cartilage media consisting of DMEM, 10% FBS, non essential amino acids, pyruvate, HEPES, ascorbate, and proline (n = 10 per condition, **p < 0.01)

