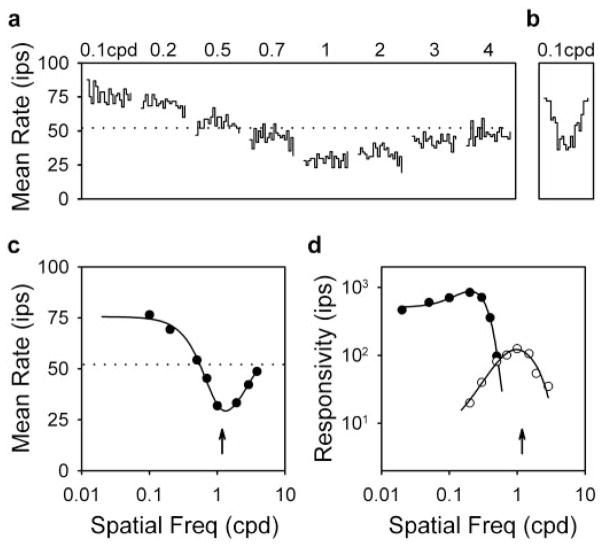
Figure 2.
Remote stimulation changes the mean firing rate of ganglion cells. a, PSTHs of the response of an ON-center Y-cell (3005) to remote gratings of different spatial frequency drifting at 4 Hz. Each waveform is 0.25 sec in duration. Disk diameter, 15°; grating contrast, 50%. b, PSTH of the response of the cell to a full-field grating drifting at 4 Hz. Scales are the same as in a. Grating contrast and spatial frequency, 5% and 0.1 cpd, respectively. c, Mean rate of the cell as a function of spatial frequency. The solid line is the best fit of the dual-subunit model (see Fig. 5) to the data. Parameters of the fit are KE = 55 ips, KIC = 33 ips, RE = 0.45°, and R EC = 0.11°. Dotted lines in a and c indicate the resting rate of the cell for steady uniform full-field illumination. d, Spatial frequency curves of the first-harmonic (filled circles) and second-harmonic (open circles) response of the cell to full-field drifting and contrast-reversing gratings, respectively. Responsivity is the response amplitude at each spatial frequency divided by the contrast required to evoke it. Solid lines give the best fit of a difference-of-Gaussian model (Rodieck, 1965; Enroth-Cugell and Robson, 1966) to the data. Parameters of the first- and second-harmonic fits are KC = 1500 and 161 ips, KS = 1015 and 154 ips, RC = 0.95 and 0.15°, and RS = 2.10 and 0.54°, respectively. Freq, Frequency.

