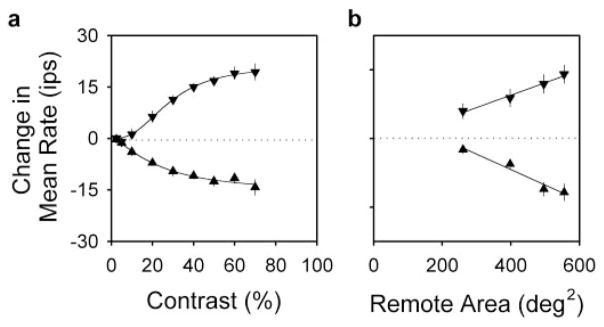
Figure 7.
Remote effects on mean rate require moderate-to-high contrast stimulation of widespread areas of the retina. a, Average mean rate change of 15 Y-cells for 0.1 cpd (downward triangles) and 1 cpd (upward triangles) remote gratings of different contrast. Thin lines plot the best fit of a Naka-Rushton type of equation (M = M∞[Cx/[Cx + C0.5 x)]) to the data. M∞, the maximum change in mean rate, was 21 and −16 ips for the 0.1 and 1 cpd grating, respectively. C0.5, the contrast at half mean-rate saturation, was 28 and 23%. And, x was 2.6 and 1.5. Disk diameter, 10–15°. b, Average mean rate change of 14 Y-cells for remote gratings covering different amounts of the display. Remote area equals display area (600 deg2) minus disk area. Symbols are the same as in a. Thin lines are linear regression fits of the data. Error bars indicate SEMs. Grating contrast, 50%.

