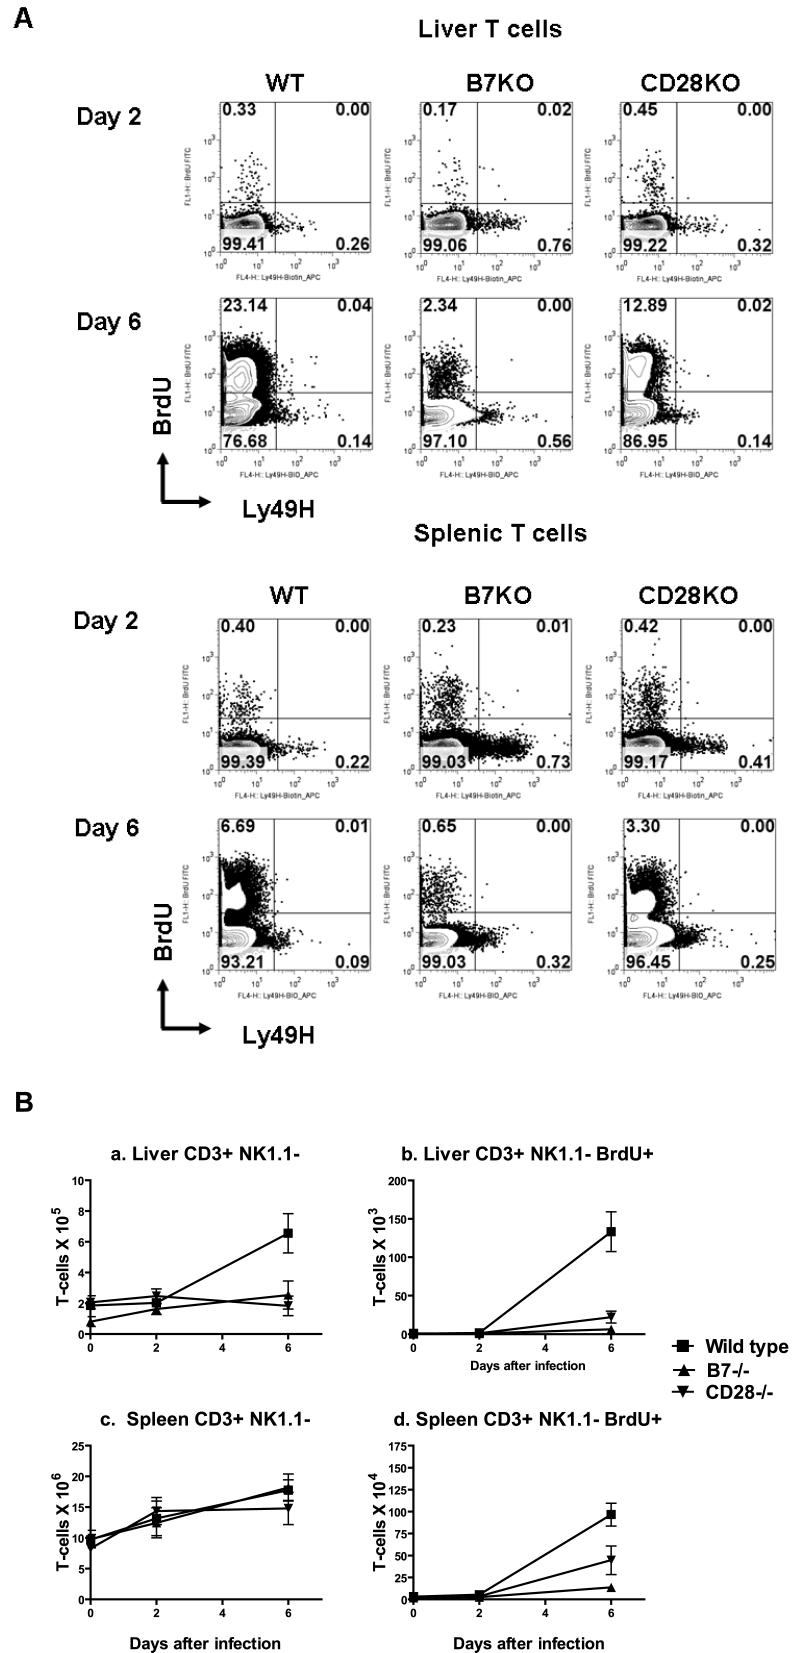
Figure 2. Costimulation in T-cell responses during acute MCMV infection.
Wild type C57BL/6, B7-/- or CD28-/- knockout mice infected with Smith MCMV (5 × 10⁴ pfu) or vehicle had liver and spleen tissues removed 2 or 6 days after infection. Three hours prior to organ removal, each mouse received i.p. 1.0 mg BrdU. Single splenocyte preparations or hepatic MNCs were prepared, stained with MAb to CD3 (PerCP-Cy5.5), NK1.1 (APC), and Ly49H (PE) followed by intracellular staining with mAb to BrdU (FITC) as described in Methods, and analyzed by flow cytometry. CD3+NK1.1- T cells were gated and analyzed for BrdU and Ly49H expression (A). Note that a small portion of CD3+NK1.1-BrDU-T cells expressed Ly49H, consistently with our previous observation (unpublished data). A. Representative flow cytometric plots of liver and spleen from mice at day 2 or 6 pi. B. T-cell numbers for each group at various time points pi from a representative experiment. Each data point represents mean ± standard error for n=3 mice. The experiment was repeated twice with similar results.

