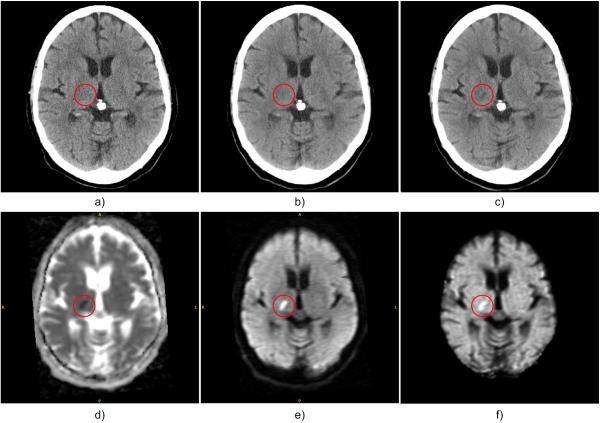
Fig. 1.
Example of hyperacute ischemic stroke region (in red circle): a) first ncCT (1h 51min); b) second co-registered ncCT (4h 19min); c) third co-registered ncCT (24h 3min) shows a stroke lesion that matches the MR-DW abnormality; d) MR-ADC (48h 18min); e) MR-DWI; f) MR-eADC. The times in parentheses denote the time differences between stroke onset and the actual scans.

