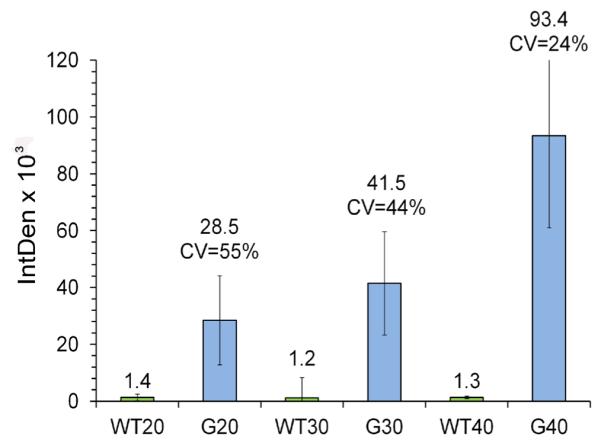
Figure 1. Quantitative analysis of age related increment of reticulin fibrosis in Gata-1low mice.

Sixty images (2 slides, each with three consecutive sections) per mouse, with three animals per genotype at 20, 30 and 40 weeks old of age, totalizing 360 images, were batch processed as described under Materials and Methods. Wild type (denoted as WT) and Gata-1low (denoted as G) genotypes were analyzed. The mean integrated density (IntDen) and coefficient variance [CV = (SD/Mean) × 100] values are indicated on top of the bars. The CV indicates what percentage of the mean value is the SD. Shown are means ± SD. After rejecting the one-way ANOVA null hypothesis (P < 0.05) for the analysis of the 3 groups (G20, G30 and G40), the inequalities (statistical differences) among their mean values, was confirmed by applying the Tukey-Kramer multiple, pair-wise comparison test.
