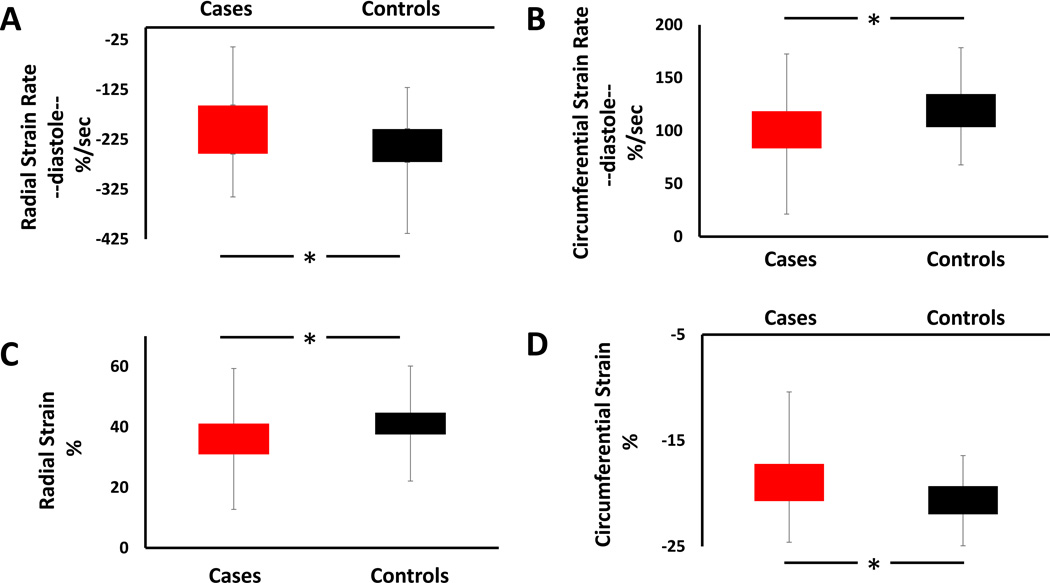
Figure 2.
Group strain and strain rate data, comparing cases with coronary microvascular dysfunction (red bars) with healthy matched controls (black bars). Top panels (A and B) illustrate group differences in radial diastolic strain rate (A) and circumferential diastolic strain rate (B). Bottom panels (C and D) illustrate group differences in peak radial (C) and circumferential (D) strain. * indicates P < 0.05.

