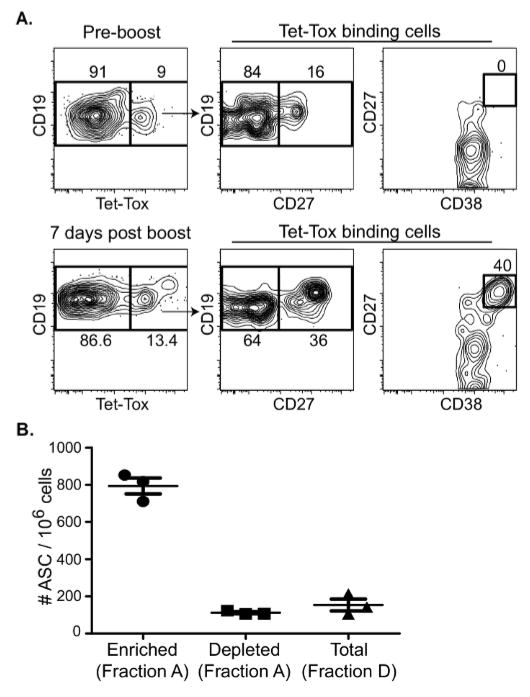
Figure 3. Examples of post-enrichment analysis of antigen-binding cells.
(A) Representative flow cytometric analysis of cell phenotype following enrichment of Tet-Tox-binding B cells. Cytograms depict identification and analysis of Tet-Tox-reactive naïve (CD27-), memory (CD27+), and plasmablasts (CD27++ CD38++) in B cell subpopulations of a subject before and 7 days after booster vaccination against tetanus. All cells were gated on CD19+ lymphocytes from the enriched “positive” populations. (B) Representative ELISPOT analysis of antibody secreting cells in enriched, depleted, and total unenriched B cell fractions from peripheral blood of a healthy subject 7 days after boost. For the ELISPOT assay, wells of a 96 well plate were first coated with a 10 μg/ml solution of tetanus-toxoid. Two-fold serial dilutions of cell suspensions were made in wells (across the plate) starting with cells at equal concentration from the enriched, depleted, and total unenriched fractions. Anti-tetanus antibody secreting cells were detected with biotinylated anti-human IgG (H&L), followed by Streptavidin-AP. The plate was developed with ELISPOT development buffer and the reaction was stopped by washing the plate three times with double-distilled H2O. The number of spots at a cell dilution in the linear range was determined, and the number of ASCs was calculated.

