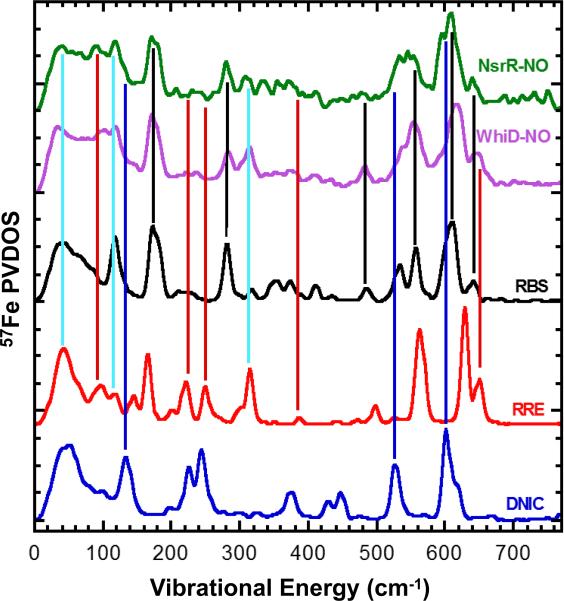
Figure 4. Comparison of NRVS spectra of DNIC, RRE and RBS with those of WhiD-NO and NsrR-NO.
Black, red and blue lines indicate the signals that correspond to the RBS, RRE and DNIC model compounds, respectively. Light blue lines highlight the signals that appear in both WhiD-NO and NsrR-NO samples and both RBS and RRE model spectra. RRE and DNIC models utilised methyl thiolate ligands.

