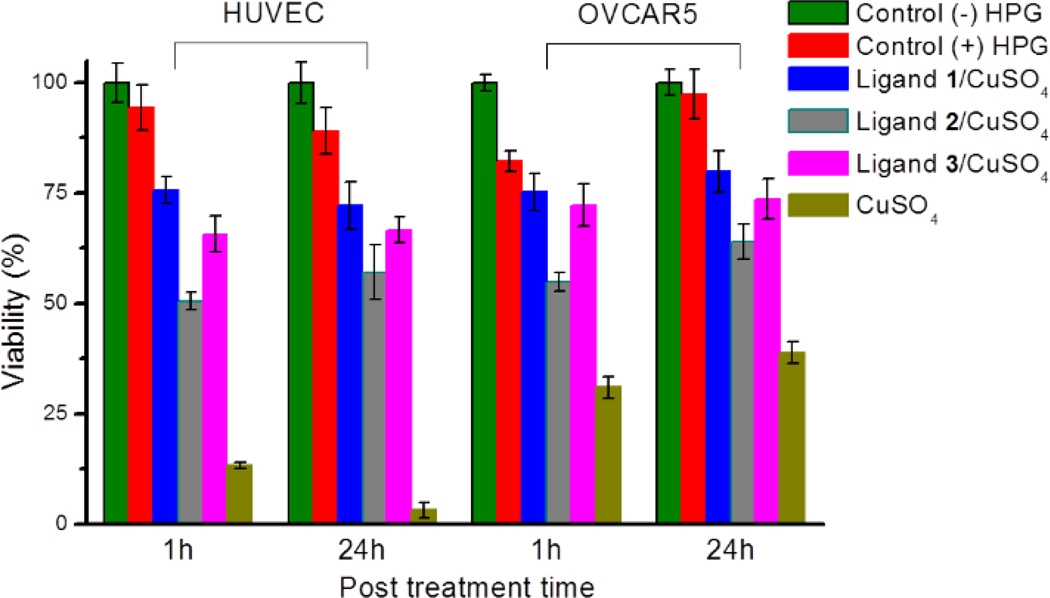
Fig. 4.
Cell viability after treatment with 100 µM 8, 100 µM CuSO4, 200 µM ligand, 500 µM sodium ascorbate in 10/90 (v/v) methionine-free DMEM/PBS for 10 minutes. Cell viability is normalized with the absorbance of negative control of cells without any treatment. Error bars represent the standard deviation of the data from three samples.

