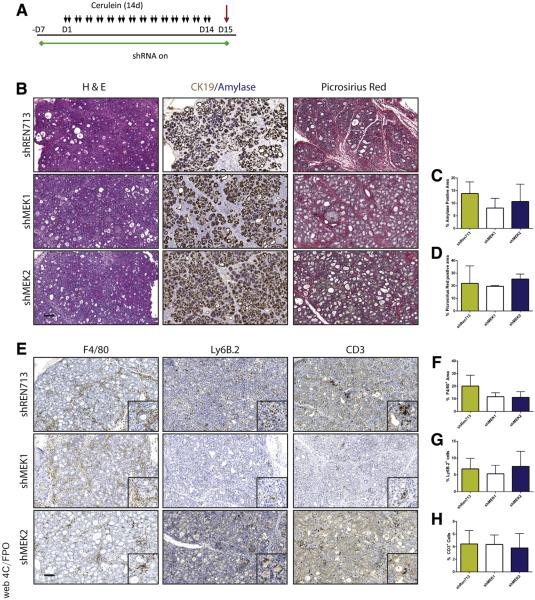
Figure 3.
Knockdown of MEK1, MEK2, or non-target control has no effect on induction of CP. (A) Schematic representation of CP protocol after initiation of shRNA expression. (B) Histologic representation of tissue remodeling with respective quantitation. (C and D) n ≥ 3 for all groups. (E) Immunohistochemistry for macrophage, neutrophil, and T-cell infiltration. (F–H) Quantitation of respective immunohistochemistry staining; error bars represent mean with standard deviation, n ≥ 3 in all groups. Scale bars = 100 μm for panels, 50 μm for insets.

