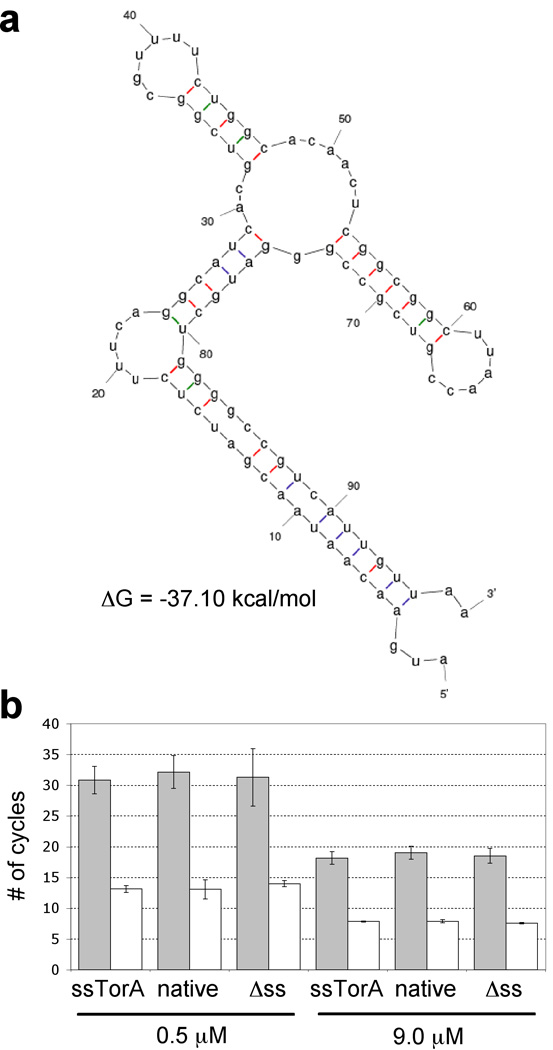
Figure 4.

mRNA stability analysis of PhoA constructs. (a) Predicted mRNA secondary structure and thermodynamic stability of sstorA transcript using the mfold program (Zuker, 2003). (b) Quantitative real-time PCR analysis of mRNA isolated from FÅ113 cells expressing Tat-targeted (ssTorA), Sec-targeted (native), and cytoplasmic (Δss) PhoA. Gray bars indicate phoA levels while white bars correspond to 16s rRNA controls. Data for two different primer concentrations (0.5 and 9.0 µM) is shown and is the average of 3 replicate experiments.
