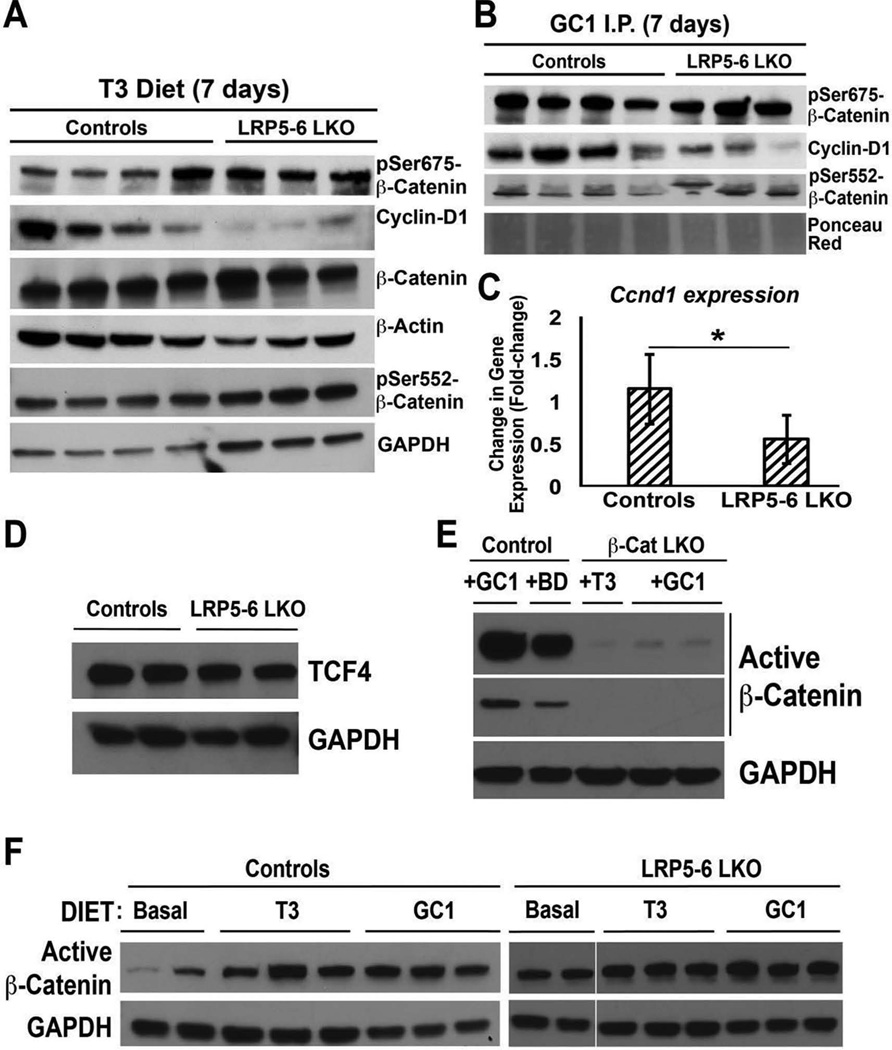
Figure 6.
T3 and GC-1 induce β-catenin activation via both PKA and Wnt signaling. (A) Representative Western blots showing comparable total β-catenin levels in liver lysates from controls and LRP5-6 administered T3 diet for 8 days. Despite increased levels of pSer675-β-catenin and pSer552-β-catenin, decreased cyclin D1 was evident in the LRP5-6-LKO group. GAPDH and β-actin were loading controls. (B) Representative Western blots showing comparable total β-catenin levels in liver lysates from controls and LRP5-6 injected with GC-1 for 8 days. Despite comparably high levels of pSer675-β-catenin and even greater pSer552-β-catenin levels in LRP5-6-LKO liver lysates, cyclin D1 levels were notably lower in this group. Ponceau Red shows comparable loading in all lanes. (C) RT-PCR shows reduced mRNA expression of cyclin D1 gene in the livers from GC-1-injected LRP5-6-LKO as compared to controls (one-tailed t-test, *p < 0.05). (D) Western blot shows comparable levels of TCF4 in the liver lysates of LRP5-6-LKO and littermate control livers. GAPDH shows equal loading in all lanes. (E) Representative Western blot shows that 8 days of GC-1 diet fed to animals leads to notably increased levels of active β-catenin (upper panel, darker exposure; lower panel, lighter exposure). Liver lysates from T3 or GC-1 administered β-cat-LKO show very low levels of active β-catenin, presumably from the nonparenchymal cells. GAPDH represents comparable loading in all lanes. (F) Representative Western blot shows notable increase in active β-catenin levels in liver lysates from control littermates administered T3 or GC-1 for 8 days as compared to basal diet. However, comparable levels of active β-catenin were observed in LRP5-6-LKO liver lysates fed basal diet or administered T3 or GC-1 diet for 8 days. GAPDH depicts equal loading in each lane.

