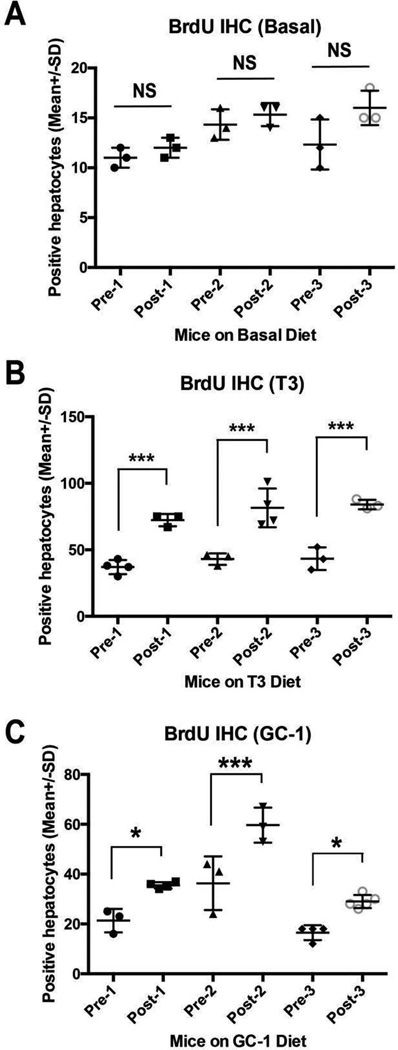
Figure 8.
Increased hepatocyte proliferation after partial hepatectomy in mice pretreated with T3- or GC-1-supplemented diet for 8 days. (A) Bar graph showing no significant (NS) differences in the average number of number of BrdU-positive hepatocytes per 100× field in liver sections in three independent mice on basal diet at the time of hepatectomy (Pre-1–3) versus at 24 h after hepatectomy in the same animals (Post-1–3). (B) Bar graph showing significant differences (***p < 0.001) in the average number of number of BrdU-positive hepatocytes per 100× field in liver sections in three independent mice on T3 diet at the time of hepatectomy (Pre-1–3) versus at 24 h after hepatectomy in the same animals (Post-1–3). (C) Bar graph showing significant differences (*p < 0.05; ***p < 0.001) in the average number of number of BrdU-positive hepatocytes per 100× field in liver sections in three independent mice on GC-1 diet at the time of hepatectomy (Pre-1–3) versus at 24 h after hepatectomy in the same animals (Post-1–3).

