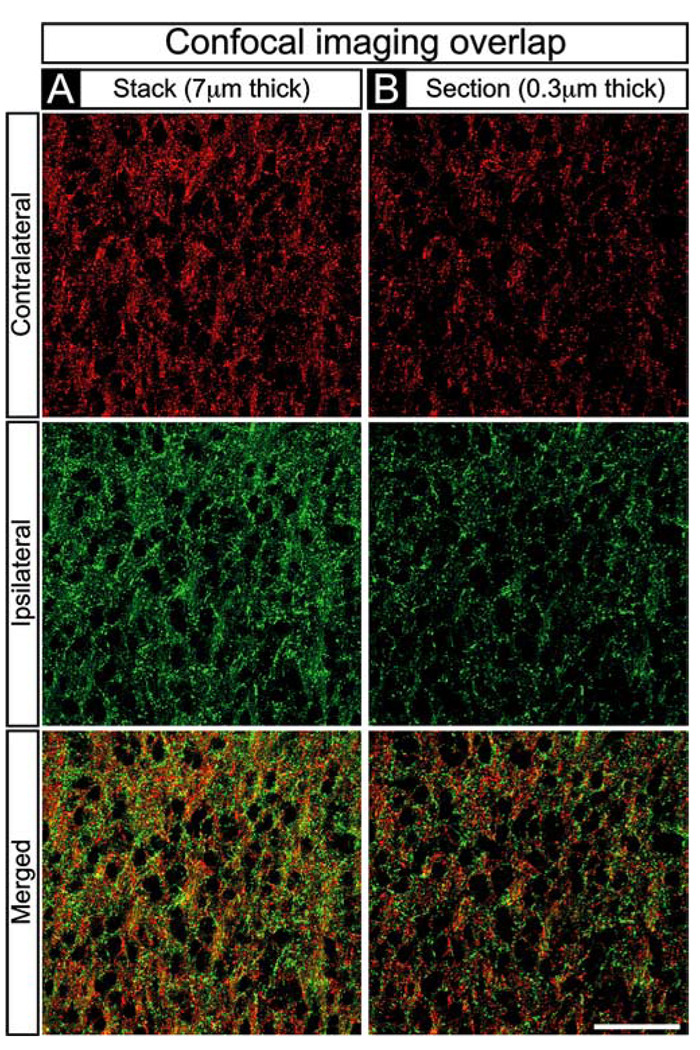
Figure 4.
Confocal imaging of binocular overlap in the dLGN. A, B, High-magnification confocal images of a region from the E78 M division dLGN in which overlap appeared maximal (“yellow” boxed region in Fig. 3B). Contralateral retinal axons (top rows), ipsilateral retinal axons (middle rows), and their merged representation (bottom rows) are shown. A, A 7.0-µm-thick Z-stack.B, A 0.3-µm-thick single optical plane.A,B, Black oval profiles are dLGN cells. Red and green profiles appear punctate at high magnification, are present at approximately equal density, and surround every cell profile in the field of view, indicating that axons from the two eyes are intermingled at the level of single dLGN neurons. Scale bar, 50µm.

