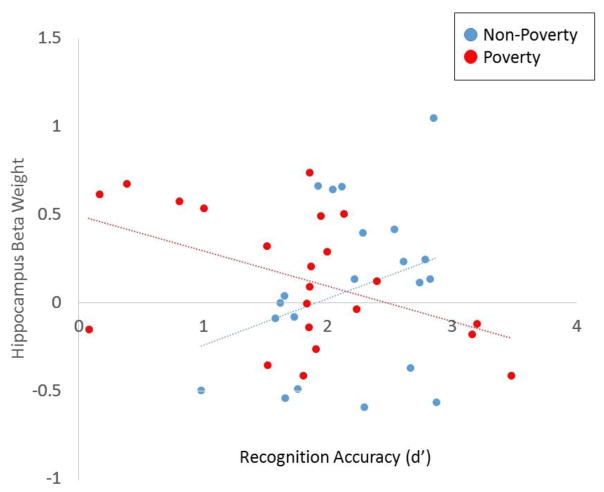
Figure 3.
Results of regression analysis demonstrating variations in the association between accuracy and hippocampal activation across income levels. For illustrative purposes, we divided participants into two groups (non-poverty, poverty) based on the continuous income measure, to graph the income x hippocampal function interaction on d′. The non-poverty group (blue dots) represent adults with no history of poverty, while the poverty group (red dots) represent those who reported living below the poverty line at age 9.

