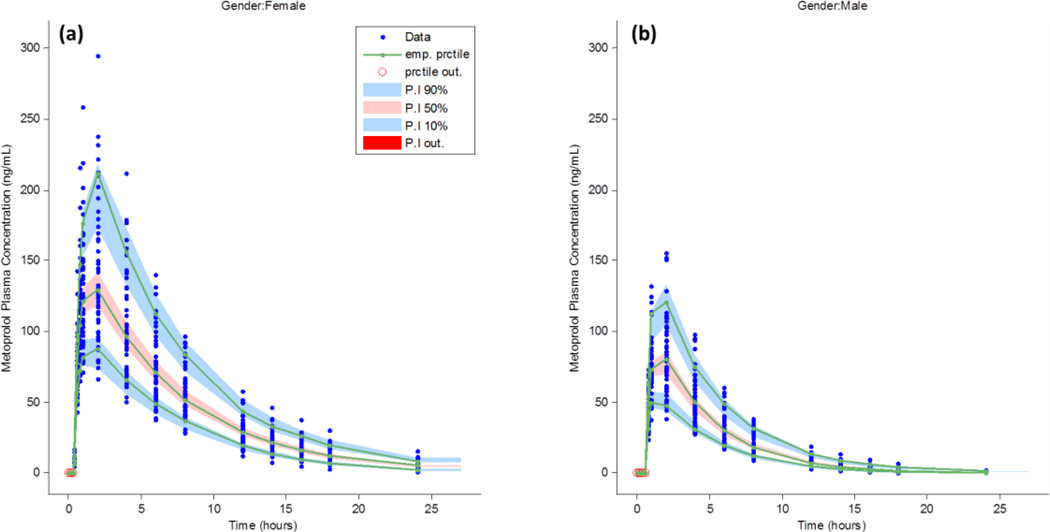
Figure 5.
The prediction-corrected visual predictive check (PC-VPC) for a clinical trial simulation of metoprolol concentration–time plasma levels for healthy young women (a) and men (b). The shaded regions depict the 95% confidence intervals around the 10th, 50th, and 90th percentile range of plasma concentrations, while the solid line illustrates the average population pharmacokinetic metoprolol concentration. Legend: emp. Prctile is the empirical percentile, prctile out is the percentile out, P.I. 90%, 50%, 10% and P.I. out are the 95% confidence intervals for the 10th, 50th, and 90th percentiles while the P.I. out is the data predicted percentile out of the PC-VPC prediction interval(s).

