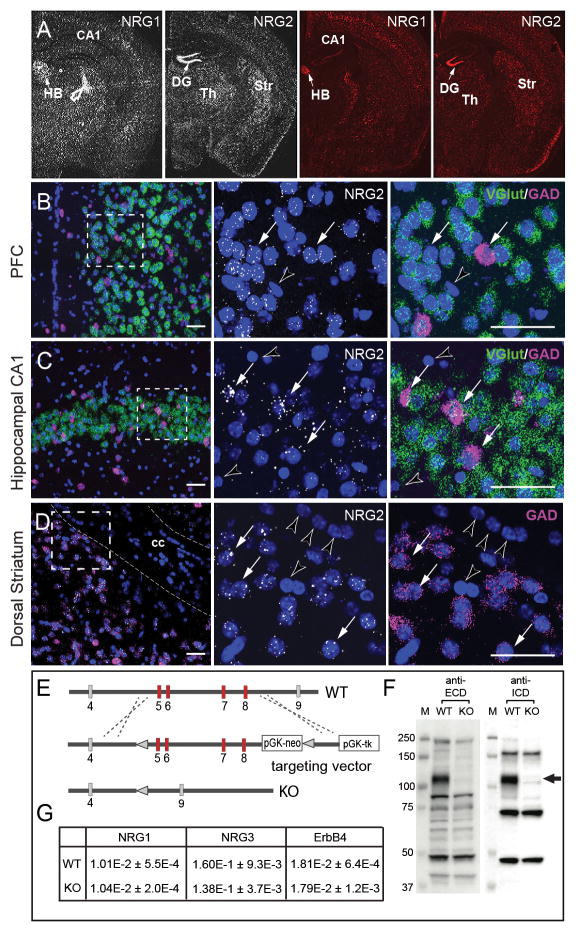
Figure 1. Expression patterns of NRG1 and NRG2 differ in adult brain.
A) ISH analyses for NRG1 and NRG2 were performed using either antisense 33P-labeled cRNA probes (left) or RNAScope oligonucleotides probe sets (right). Representative low-magnification dark-field and fluorescence images of adult mouse coronal sections show differential regional expression of both NRGs in the habenula (HB), hippocampal dentate gyrus (DG) and CA1, thalamus (Th), and striatum (Str). Arrows indicate areas of highest NRG1 (HB) and NRG2 (DG) expression; open arrow indicates an emulsion artifact. B-D) The distribution of NRG2 transcripts in glutamatergic and GABAergic neurons in the (B) prefrontal cortex (PFC), (C) hippocampus and (D) dorsal striatum were analyzed by triple ISH using RNAScope probes for NRG2 (white), vGlut (green) and GAD (magenta); nuclei were labeled with DAPI (blue). The middle and right panels correspond to the boxed area taken at higher magnification. Arrows indicate NRG2-expressing neurons, arrowheads mark neurons and presumably glial cells in the corpus callosum (cc) devoid of hybridization signal. Scale bar: 50 μm. E) Diagram of the Nrg2 region spanning exons 4 to 9 targeted by homologous recombination; targeted exons 5–8 shown in red (see Supplementary Information). F) Western blots of cerebellar lysates from NRG2 KO and WT mice probed with antibodies against the extracellular (ECD) and intracellular (ICD) domains of NRG2. Arrow indicates the position of the pro-NRG2 band absent in NRG2 KO brain tissue. G) Semi-quantitative RT-PCR analysis reveals no compensatory changes in ErbB4, NRG1 and NRG3 mRNA levels in whole brain RNA preparations from adult NRG2 KO compared to wild-type littermate mice. Data are relative to β-actin and shown as means ± S.E.M. (n=4 per group; p>0.05 for all targets; Student’s t-test).

