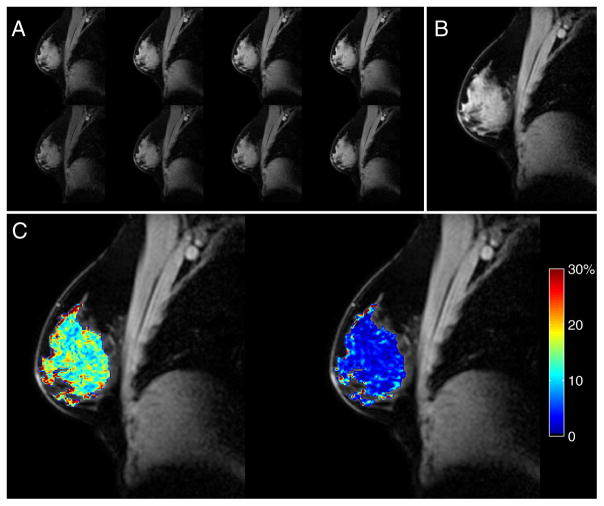
Figure 1.
Quantitative magnetization transfer magnetic resonance imaging (qMT-MRI) data are shown for a typical subject (age = 26 years): the 8 magnetization transfer (MT)-weighted images, with pulse angles of 500° (top row) and 800° (bottom row) and offsets of 1, 2, 4, and 8 kHz (left to right) (A); the normalization image (offset frequency = 100 kHz and pulse angle = 800°) (B); and the corresponding pool size ratio (PSR) map (left) and map of the standard deviation (SD) of the PSR values (right) (C) calculated during the fitting process. The mPSR ± SD for this subject and scanning session was 14.5% ± 5.9%.

