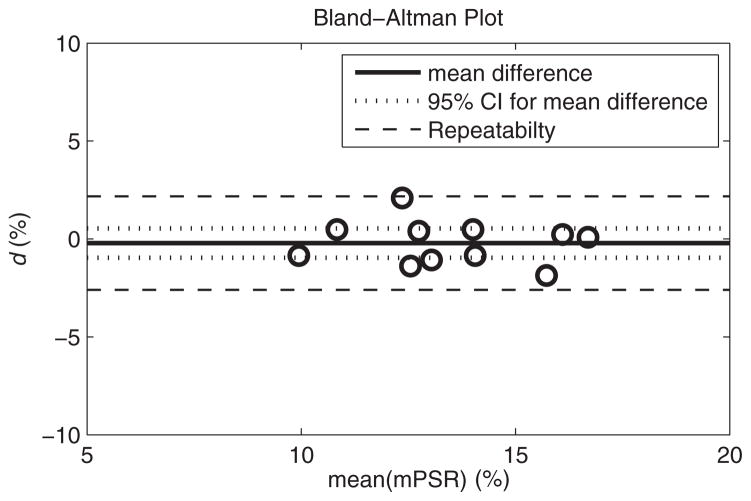
Figure 4.
Difference (d) between mean PSR (mPSR) values in the FG tissue from 2 scanning sessions plotted against the average of the 2 FG mPSR values for each volunteer. The overall mean difference between scans (solid line) for all 11 subjects was not significantly different from 0 (P = .543). The 95% confidence interval (CI) for the group (dotted line) was 0.75, and it represents the level of change that would be significant for a group of 11 subjects. The repeatability (dashed line) was 2.39, and it represents the level of change that would be significant in an individual.

