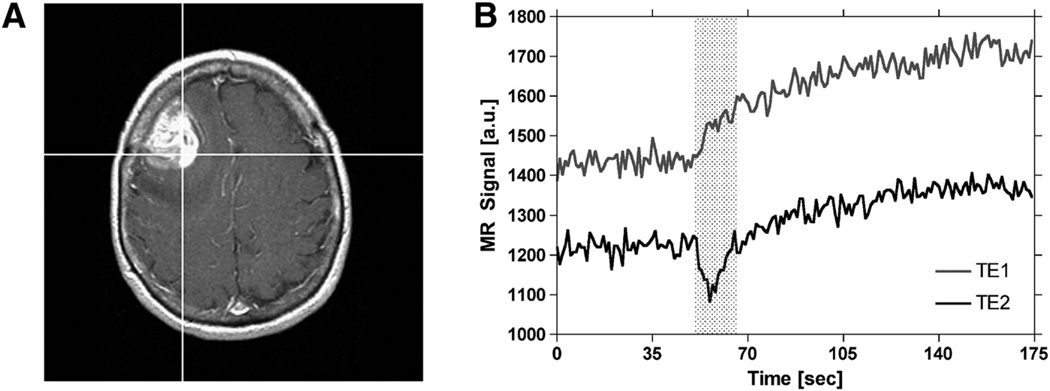
Figure 2.
Demonstration of the time course of extravasation effects in DSC-MRI. Postcontrast T1-weighted image of a patient with a high-grade glioma (A). Spiral Perfusion Imaging with Consecutive Echoes (SPICE) signals, obtained at short and long TE, for the representative tumor voxel depicted on the postcontrast T1-weighted image (B). Leakage of contrast agent begins at the appearance time of the bolus and occurs during the first pass of the bolus (indicated by the shaded region). Following the first pass, leakage continues at a slower rate until back-diffusion occurs (not shown).

