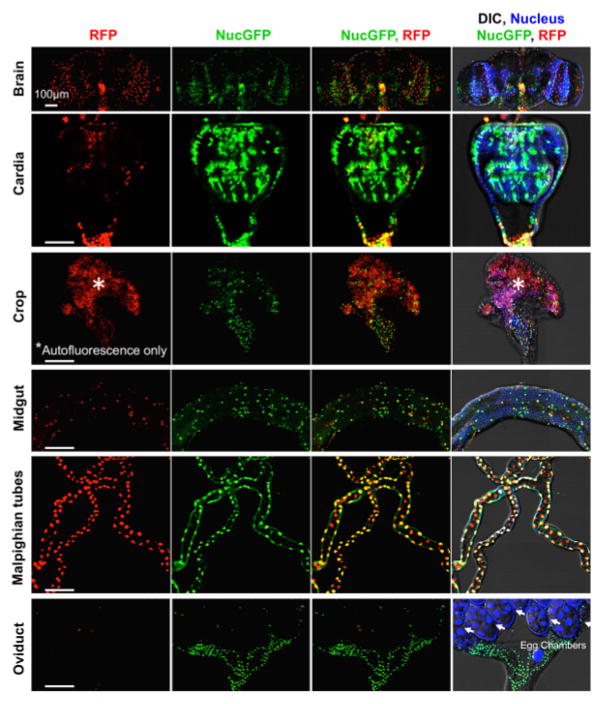
Figure 4. Basal caspase activity in many tissues.
Higher magnifications of DIC and fluorescence confocal images of GFP (past) and RFP (recent) CaspaseTracker (DQVD) activity and Hoechst-stained nuclei in the brain, cardia, crop, midgut, Malpighian tubules and oviducts from Figure 3a. *Autofluorescent structures. These data are reproduced with permission from Tang et al., Sci Rep 2015.

