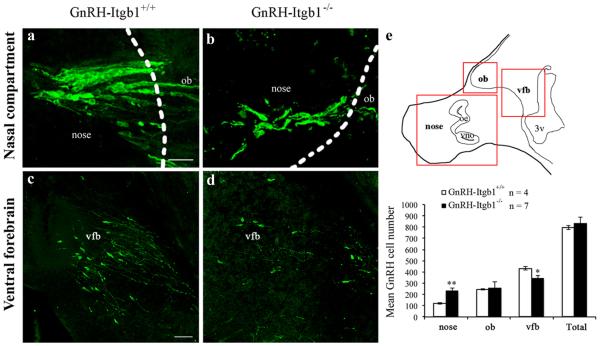
Figure 2.
GnRH-Itgb1−/− mice show defective GnRH migration during embryonic development. a– d, Confocal photomicrographs showing GnRH immunoreactivity in sagittal sections of E14.5 control (a, c) and GnRH-Itgb1−/− (b, d) embryo heads. Dashed lines indicate the boundary between the nose and the forebrain. Analysis of the location of GnRH neurons in three regions along the migratory pathway, nasal compartment (nose), olfactory bulb (ob), and ventral forebrain (vfb) reveals a significant accumulation of cells in the nasal region of GnRH-Itgb1−/− mice when compared with control mice (a, b). Consistently, fewer GnRH neurons are located in the vfb of GnRH-Itgb1−/− than of GnRH-Itgb1+/+ embryos (c vs d). e, Top, Schematic of a sagittal section of an E14.5 embryo. Red boxes indicate the areas of the analysis of GnRH cell distribution. oe, Olfactory epithelium; vno, vomeronasal organ. Bottom, Quantitative analysis revealed a migratory defect of GnRH neurons at this developmental stage. Data are represented as means ± SEM (n, number of embryos; **p < 0.005, *p < 0.05, Fisher ’s least significant difference post hoc analysis). Scale bars: (in a) a, b, 20 μm; (in c) c, d, 40 μm.

