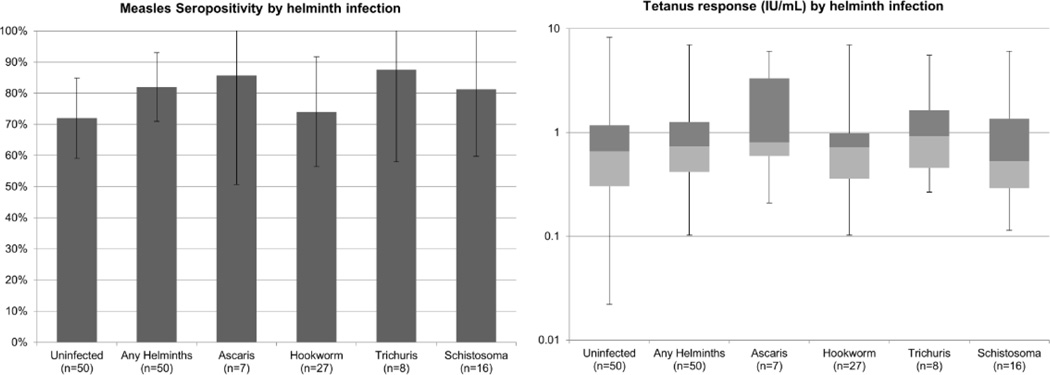
Fig 2. Study 1 – Measles and tetanus antibody responses among helminth infected compared with uninfected individuals with HIV-1 infection.
Mean prevalence of measles seropositivity with 95% confidence intervals are shown by helminth infection status. Helminth infected groups were compared to the reference group, helminth uninfected, using Chi-squared test. Tetanus responses are shown as median response with box representing 25% and 75% percentile bounds, and whiskers representing minimum and maximum values by helminth infection status. Log10 tetanus response was used to compare each helminth infected group to the reference group, helminth uninfected, using Student’s T-test. P > 0.2 for all comparisons.

