
Figure 5.
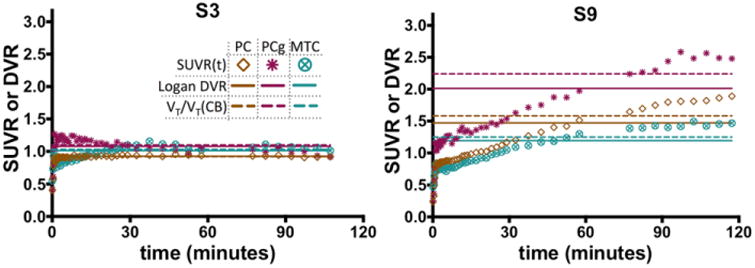
SUVR time courses (symbols), DVR estimated directly by Logan regression with reference region inputs (horizontal solid lines), and indirect estimates of DVR given by VT/VTREF from compartmental modeling with arterial inputs (horizontal dashed lines) for a control subject (S3) and an MCI subject (S9).