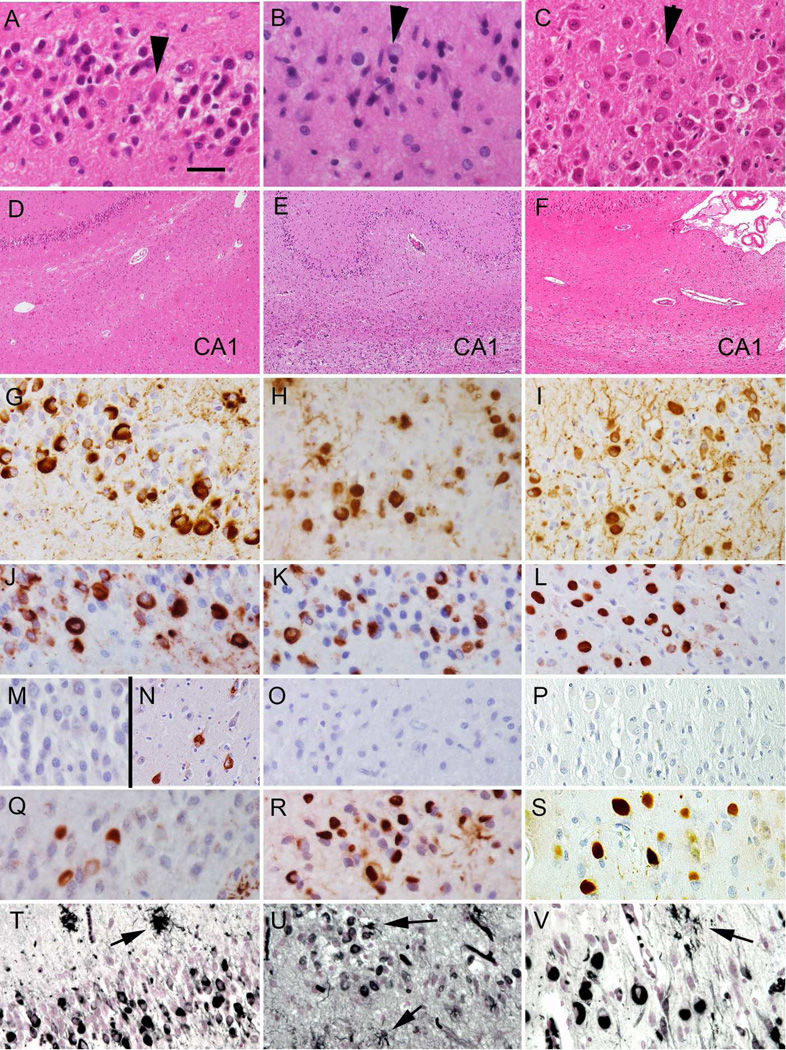
Figure 1.
Basophilic inclusions in the dentate gyrus (A–C; indicated by arrowheads) and variable cell loss in the CA1 subregion (D–F) in the three cases (A,D: case 1; B, E: case 2; C, F: case3) reported in this study. Immunostaining for PHF-1 (G–I), 4R tau (J–L), 3R tau (M–P), p62 (Q–S) and for Gallyas silver staining (T–V) in cases 1 (G, J, M, N, Q, T), 2 (H, K, O, R, U) and 3 (I, L, Q, P, S, V) demonstrating the spherical inclusions in the dentate gyrus. Immunostaining for 3R tau in the CA1 subregion (N) demonstrates neurofibrillary tangles in case 1 corresponding to the immunoblot results. Note the argyrophilic astrocytes in T–V (arrows). The bar in A represents 25 µm for A–C, G–V and 100 µm for D–F.

