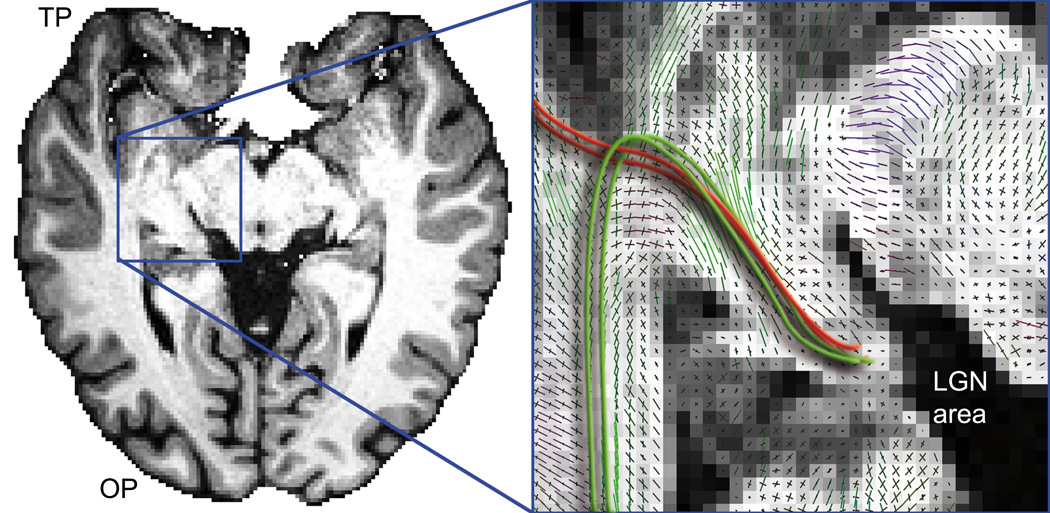
Figure 2.
Anatomical T1-weighted image at the level of Meyer’s loop (axial slice). Zoomed view shows multiple kissing and crossing peaks in Meyer’s loop area. Red lines represents streamlines propagating towards the TP from the LGN when following similarly aligned peaks in the field of orientations. Green lines illustrate the expected anatomical course of Meyer’s loop.

