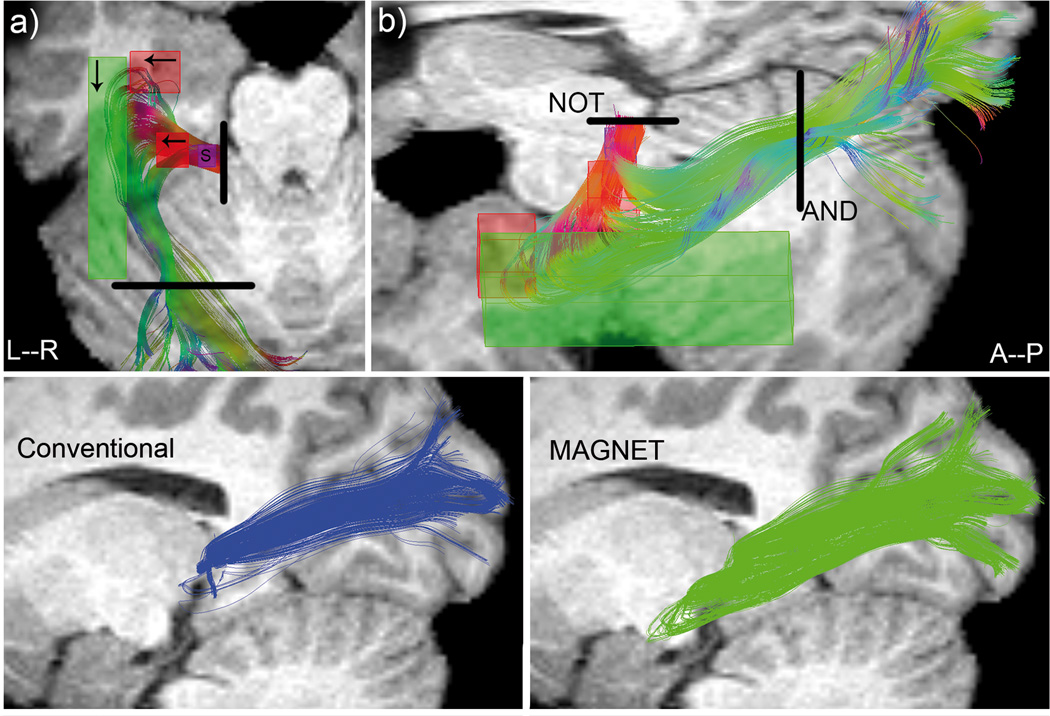
Figure 4.
Top: ROIs positioning illustrated for a single subject (S11). Purple box: seed region. Black lines: Boolean ROIs. Arrows indicate the direction of Vmagnet. a) superior view. b) lateral view (oblique). Bottom: qualitative comparison between deterministic (left, blue) and MAGNET (right, green) reconstruction of Meyer’s loop for the same subject. A deeper anterior extent is noticeable with MAGNET (green).

