

Abstract
Purpose
To test the utility of magnetization transfer imaging (MTI) in detection and monitoring the progression of renal fibrosis in mice with unilateral renal artery stenosis (RAS).
Materials and Methods
This prospective study was approved by the Institutional Animal Care and Use Committee. RAS (n=10) or sham surgery (n=5) was performed, and the stenotic and contralateral kidneys were studied longitudinally in-vivo at baseline and 2, 4 and 6 weeks post-surgery. Following a 16.4T MRI exam, magnetization transfer ratio (MTR) was measured as an index of fibrosis (guided by parameters selected in preliminary phantom studies). In addition, renal volume, perfusion, blood flow and oxygenation were assessed. Fibrosis was subsequently measured ex-vivo by histology and hydroxyproline assay. The Wilcoxon rank-sum or signed-rank test was used for statistical comparisons between or within groups, and Pearson’s and Spearman’s rank correlation to compare fibrosis measured in-vivo and ex-vivo.
Results
In the stenotic kidney, the median MTR showed progressive increases from baseline to 6 weeks post-surgery (by 13.7% [P=0.0006] and 21.3% [P=0.0005] in cortex and medulla, respectively), which were accompanied by a progressive loss in renal volume, perfusion, blood flow, and oxygenation. The 6-week MTR map showed good correlation with fibrosis measured ex-vivo (Pearson’s r=0.9038 and Spearman’s ρ=0.8107, P=0.0002 vs. trichrome staining; r=0.9540 and ρ=0.8821, P<0.0001 vs. Sirius red staining; r=0.8429 and ρ=0.7607, P=0.001 vs. hydroxyproline assay).
Conclusion
MT successfully measured and longitudinally monitored the progression of renal fibrosis in mice with unilateral RAS.
INTRODUCTION
Renal artery stenosis (RAS) decreases renal blood flow (RBF) and causes a progressive loss of renal mass and function. The affected kidney undergoes a progressive deposition of extracellular matrix (ECM) components containing fibronectin and collagen type I, III, and IV, which may evolve into tubulointerstitial fibrosis (1, 2). Renal fibrosis is an important marker in diagnosis and evaluation of renal diseases, like kidney outcomes after transplantation (3, 4). Currently, renal biopsy is the reference standard method to assess renal fibrosis, but is limited by invasiveness, possible sampling error, and intra/inter-observer variability (5).
Several magnetic resonance imaging (MRI) techniques have been explored for noninvasive detection of renal fibrosis. Diffusion-weighted imaging (DWI) is sensitive to changes in microstructure and is capable of detecting renal fibrosis (6–9), but is non-specific and largely affected by structural and functional alterations besides fibrosis (6, 7). MR elastography (MRE) measures the stiffness of tissues, which may be elevated due to fibrosis among other causes (10). MRE-determined medullary stiffness correlated well with medullary fibrosis in swine RAS kidneys, whereas cortical stiffness was also dependent on perfusion pressure (11, 12). Therefore, a noninvasive method that can directly detect renal fibrosis is in dire need.
Magnetization transfer imaging (MTI) can be used to evaluate the presence of macromolecules, e.g., proteins, lipids, carbohydrates and nucleic acids in tissues (13, 14). MTI has been applied to detect microstructural disruptions in the brain (15, 16), lungs (17), intestines (18–20), and rectal cancer (21). Recently, MTI was applied for the evaluation of nephropathy, including unilateral ureteral obstruction (22) and polycystic kidney disease (23). However, the utility of MTI for detection of renal fibrosis cannot be easily evaluated in these two models due to concomitant accumulation of fluids, which is unlikely to be present in RAS. A previous study showed the promise of MT-weighted imaging with empirically chosen parameters in detecting fibrotic tissues in RAS mice (24). However, its ability to monitor progression of fibrosis in RAS longitudinally was not evaluated. In addition, the suitable MT parameters remain to be determined and refined.
Therefore, our study aimed to test the utility of MTI in noninvasive detection and monitoring of the progression of renal fibrosis in mice with unilateral RAS. We sought to determine appropriate MT parameters for fibrosis detection, and hypothesized that in-vivo MT would correlate with both ex-vivo measurement of collagen content and a fall in renal hemodynamics and oxygenation.
MATERIALS AND METHODS
Animals
This prospective study was approved by the Institutional Animal Care and Use Committee. Fifteen male 129S1 mice were used. At the age of 10 weeks all mice underwent a baseline MRI (K.J. and C.M.F., 6 and 3 years of experience in small-animal MRI, respectively), after which they were selected for RAS (n=10) or sham (n=5) surgeries (see Appendix) by an experienced technologist (H.T., 24 years of experience). To longitudinally monitor progression of fibrosis, follow-up MRI scans were performed (K.J. and C.M.F.) 2, 4 and 6 weeks post-surgery, intervals shown to induce progressive renal injury (25). Animals were weighed and blood pressure measured (H.T.) after MRI by tail-cuff (XBP1000 system, Kent Scientific, Torrington, CT).
MT Parameters
MRI studies were performed on a vertical 16.4T scanner, equipped with a 38mm inner diameter birdcage coil (Bruker Biospin, Billerica, MA). In the MT study, a fast low-angle shot (FLASH) sequence was utilized. FLASH images without MT (Mo) were acquired with the following parameters: TR 400ms; TE 2.9ms; flip-angle 20°; slice-thickness 1mm; slice-number 5; FOV 3.0×3.0cm2; matrix size 128×128; number of averages 4. Then MT-weighed images (Mt) were acquired by adding Gaussian MT pulses before FLASH acquisition.
A robust set of parameters for MT pulses is necessary for effective saturation of collagen without inducing significant radiofrequency (RF) heating. Irradiation-offset frequency, which determines the sensitivity of MT saturation, was first determined in a phantom containing collagen I&III (NeoCell, Newport Beach, CA) at 20%, 10%, 5% and 0% concentrations (Fig 1) (K.J.). To achieve a good saturation of collagen molecules, a range of irradiation-offset frequencies (−6000 to 6000Hz) and additional MT parameters (including pulse-power, bandwidth, flip-angle and pulse-number) were tested, and those judged to yield a high contrast-to-noise ratio (CNR) selected for in-vivo confirmation.
Figure 1.
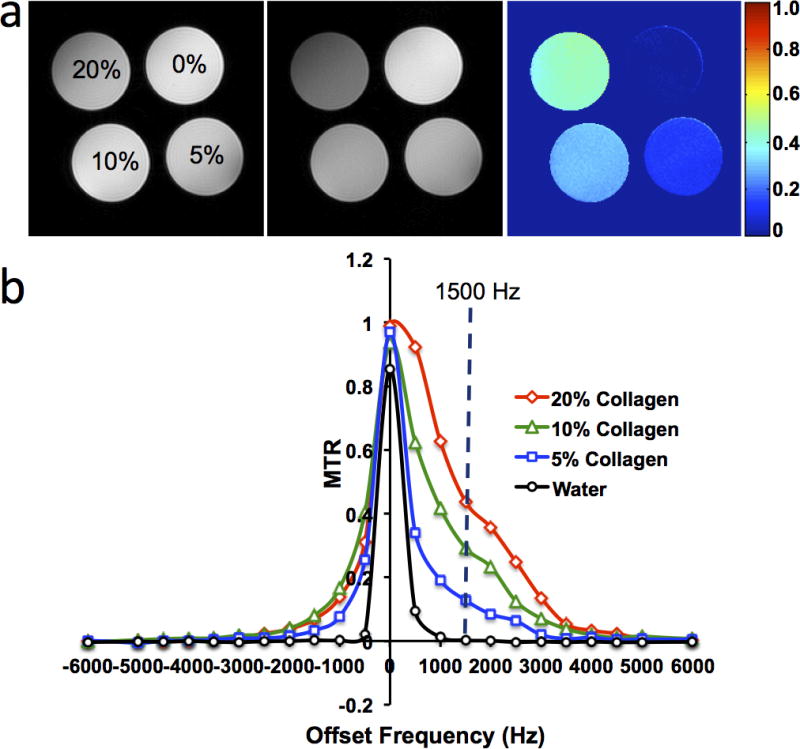
Collagen phantom study. (a) M0 and Mt images, and the magnetization transfer ratio (MTR) map with offset-frequency at 1500Hz and bandwidth at 300Hz for different concentrations of collagen. (b) Changes in MTR with offset-frequency.
In-Vivo MRI
Renal volume, perfusion and blood flow were measured in both stenotic and contralateral kidneys of anesthetized mice (see Appendix).
In the MT scan, the FOV and acquisition matrix were prescribed at 2.56×2.56cm2 and 256×256, yielding an in-plane resolution of 100×100μm2. To achieve desirable signal-to-noise ratio, 8 averages were used. The following MT parameters, determined from the phantom and preliminary in-vivo experiments, were used: offset-frequency 1500Hz; pulse-bandwidth 300Hz; pulse-power 10μT; flip-angle 585°; number of pulses 2.
Renal oxygenation was assessed by blood oxygen level-dependent (BOLD) MRI using a respiration-gated 3D multi-echo gradient echo sequence to eliminate external field inhomogeneities and susceptibility artifacts (26). The imaging parameters used were: TR 200ms; TE 3.5–24.5ms; echo number 8; flip-angle 25°; slab thickness 1mm; FOV 2.56×2.56 cm2; matrix size 128×128×8; number of averages 2.
Image Analysis
Renal volumes were quantified (T.A.B., 2 years of experience) using Analyze™ (version 12.0, Biomedical Imaging Resource, Mayo Clinic, MN), and all other images using in-house developed module in Matlab® (Mathworks, Natick, MA) (K.J.). The quantification of renal volume, perfusion and blood flow are described in Appendix.
The magnetization transfer ratio (MTR), calculated pixel-wise as (M0−Mt)/M0, was used as an index of renal fibrosis. To calculate the averaged MTR, cortical and medullary region of interests (ROIs) were manually traced on the Mt image showing the best contrast between cortex and medulla with reference to the M0 image and MTR map (Fig 2a) by two experienced observers (K.J. and C.M.F). Large vessels, pelvis and necrotic areas were excluded. The same ROIs were propagated and applied for quantification of blood oxygenation, perfusion and blood flow. Mean values from all ROIs from different slices were averaged.
Figure 2.
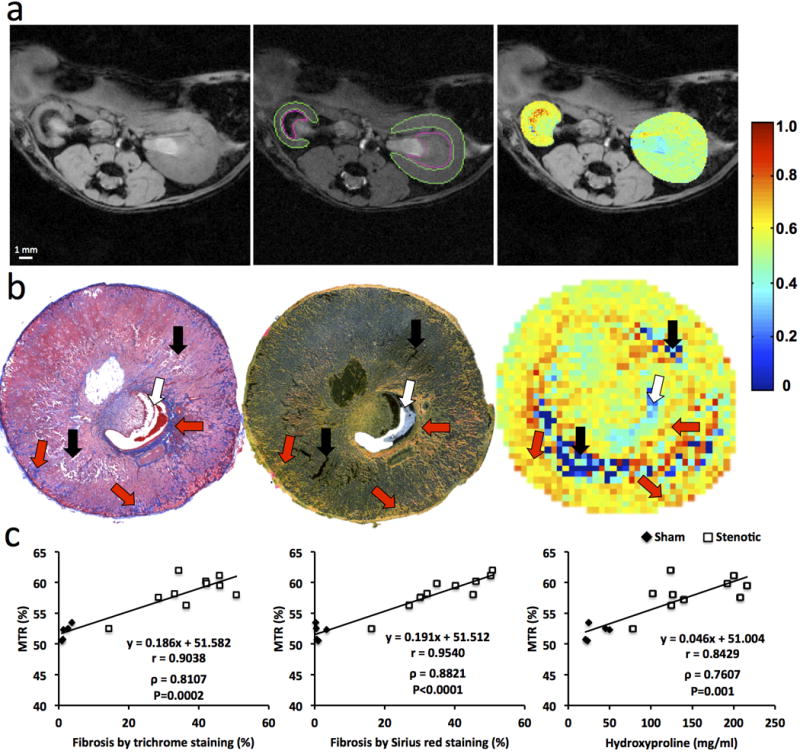
Renal Fibrosis in mice by in-vivo magnetization transfer (MT) and ex-vivo histology or hydroxyproline assay. (a) Fast low angle shot (FLASH) image without MT pulses (M0, left), MT-weighted FLASH image (Mt) overlaid with the manually traced ROIs in the cortex and medulla (middle) and calculated MTR maps of both the stenotic and contralateral kidneys overlapped with the M0 image (right). (b) Representative trichrome staining (left), Sirius red staining viewed under polarized light (middle) at a magnification of 10×, and corresponding MTR map (right) of a stenotic kidney at 6 weeks of renal artery stenosis. Increasing levels of fibrosis are indicated by intensifying yellow and appearance of red coloring. Areas representing fibrosis, necrosis, and pelvis are marked by red, black, and white arrows, respectively. (c) Spearman’s rank correlation of fibrosis quantified from ex-vivo trichrome staining (left), Sirius red staining (middle) or hydroxyproline assay (right) and in-vivo MTR. All regions of interest from different slices were used to calculate the averaged MTR in-vivo and all histological slices used for quantification of fibrosis ex-vivo.
For BOLD, 8 images were reconstructed after zero-filling the k-space data to 256×256. T2* was quantified by pixel-wise mono-exponential fitting on the averaged magnitude of all 8 images over echo times. R2* (1/T2*), was used as an index of blood oxygenation level.
Histology
Mice were euthanized after the 6-week MRI. Kidneys, blood, and urine samples were collected. One half of each kidney fixed in 10% formalin for tissue staining, and the other half flash-frozen. Masson’s trichrome and Picrosirius-red staining was performed on 5-μm axial tissue slices corresponding to MR tomographic slices (H.T.). The degree of fibrosis was quantified as the fraction of fibrotic area over the total cross-sectional area of the tissue using AxioVision (Carl Zeiss SMT, Oberkochen, Germany).
Blood Test and Hydroxyproline Assay
Refer to Appendix for details.
Statistical Analysis
Statistical analysis was performed using JMP 10.0 (SAS Institute, Cary, NC). All results were expressed as medians and interquartile ranges (IQRs). Box plots illustrate the medians and ranges of values. Due to our relatively small sample size, non-parametric distribution-free statistical analysis was employed. The Kruskal-Wallis test was used to assess difference among multiple groups and time-points, including comparisons of all values obtained from the sham (n=5) and RAS (n=10) mice at baseline and 2, 4, 6 weeks post-surgery. This was followed by the Wilcoxon rank-sum (sham [n=5] vs. stenotic [n=10] and contralateral [n=10] kidneys) or signed-rank test (paired comparisons between baseline, 2, 4, and 6 weeks post-surgery) for statistical comparisons between or within groups, as appropriate. Both Pearson’s and Spearman’s rank correlations were used to compare fibrosis measured in-vivo and ex-vivo. For the 6-week studies, in which RAS kidneys showed the most MTR heterogeneities, interobserver reproducibility was evaluated from the difference in MTR values quantified by two independent operators in ROIs selected manually and independently. A p value ≤0.05 was considered statistically significant.
RESULTS
MT Parameter Selection
Representative M0 and Mt images and the MTR map of the collagen phantom with offset 1500Hz and bandwidth 300Hz are shown in Fig 1a, and MTR values obtained at various offset frequencies in Fig 1b. An offset approaching zero resulted in a higher MT saturation, but also in stronger direct saturation of free water signal, inducing artifacts in Mt images and complicating interpretation. An offset-frequency at 1500Hz was identified to achieve a high saturation of collagen magnetization with minimal direct saturation of free water signal. With the MT pulse power empirically set at 10μT, which resulted in a flip-angle of 585°, the MTR maps with 1 to 3 pulses was tested in-vivo. Using 2 pulses yielded the most acceptable MTR map for fibrosis detection (Fig E1). Thus, the parameters of Gaussian MT pulses were set as: offset-frequency 1500Hz; bandwidth 300Hz; pulse power 10μT; flip-angle 585°; number of pulses 2.
Animal Characteristics
The animal characteristics and renal hemodynamic indices are shown in Table 1. The body weight of both groups increased from baseline to 6 weeks, but the weight gain was attenuated in RAS mice, possibly due to the surgery and hypertension. Renovascular hypertension in RAS mice was demonstrated by the increased systolic and diastolic blood pressure, which remained unchanged in the control mice. The median serum creatinine and blood urea nitrogen levels in RAS mice were significantly elevated compared to the sham group (0.15[0.13–0.21] vs. 0.09[0.03–0.12] mg/dL, P=0.0109 and 27.9[26.8–30.6] vs. 22.0[21.1–23.0] mg/dL, P=0.004, respectively) at 6 weeks post-surgery, confirming that RAS was functionally consequential and evoked loss of renal function.
Table 1.
Animal Characteristics and Renal Hemodynamic Indices
| Baseline | 2 Weeks | 4 Weeks | 6 Weeks | |
|---|---|---|---|---|
| Body Weight (g) | ||||
| RAS | 22 (20–25) | 22 (18–26) | 24 (21–26) | 25 (23–29)* |
| Sham | 22 (22–24) | 24(22–24) | 25 (24–26)* | 26 (24–27)*$ |
| Blood Pressure (mmHg) | ||||
| RAS | ||||
| Diastolic | 69 (67–73) | 87 (74–96)* | 83 (75–90)*† | 78 (69–83) |
| Systolic | 97 (93–102) | 117 (107–123)*† | 110 (105–124)*† | 108 (101–116)* |
| Sham | ||||
| Diastolic | 69 (65–81) | 71 (60–86) | 71 (69–73) | 70 (67–73) |
| Systolic | 106 (103–108) | 100 (91–112) | 99 (94–107) | 96 (92–102) |
| Volume (mm3) | ||||
| Stenotic Kidney | ||||
| Cortex | 134 (120–143) | 58 (48–68)*† | 34 (30–38)*$† | 26 (24–35)*$† |
| Medulla | 70 (59–78) | 44 (37–56)*† | 34 (26–35)*$† | 25 (17–34)*$† |
| Contralateral Kidney | ||||
| Cortex | 138 (128–141) | 197 (182–225)*† | 214 (200–239)*† | 233 (215–249)*$† |
| Medulla | 70 (59–72) | 80 (71–86)*† | 79 (71–89)*† | 75 (70–94)*† |
| Sham Kidney | ||||
| Cortex | 134 (127–141) | 142 (126–151) | 144 (141–159)* | 160 (141–163)* |
| Medulla | 61 (58–70) | 63 (56–69) | 65 (57–67) | 61 (57–69) |
| Perfusion (ml/100g/min) | ||||
| Stenotic Kidney | ||||
| Cortex | 547 (458–611) | 179 (153–244)*† | 249 (235–324)*$† | 263 (198–292)*$† |
| Medulla | 334 (241–389) | 106 (84–171)*† | 232 (199–262)*$† | 231 (194–263)*$† |
| Contralateral Kidney | ||||
| Cortex | 463 (385–547) | 455 (430–529) | 478 (433–526) | 475 (353–508) |
| Medulla | 320 (270–380) | 327 (293–384) | 339 (297–365) | 316 (251–404) |
| Sham Kidney | ||||
| Cortex | 526 (413–572) | 548 (410–563) | 467 (417–510) | 517 (475–537) |
| Medulla | 352 (319–389) | 332 (313–465) | 350 (286–405) | 323 (311–372) |
| Blood Flow (ml/min) | ||||
| Stenotic Kidney | ||||
| Cortex | 0.66 (0.62–0.71) | 0.11(0.08–0.13)*† | 0.09 (0.08–0.10)*$† | 0.08 (0.06–0.11)*$† |
| Medulla | 0.23 (0.21–0.32) | 0.05 (0.04–0.06)*† | 0.07 (0.06–0.10)*$† | 0.08 (0.06–0.09)*$† |
| Total | 0.89 (0.81–1.03) | 0.16 (0.11–0.18)*† | 0.16 (0.12–0.19)*† | 0.16 (0.11–0.20)*† |
| Contralateral Kidney | ||||
| Cortex | 0.62 (0.47–0.72) | 1.00 (0.94–1.05)*† | 1.11 (1.01–1.19)*† | 1.18 (1.17–1.54)*$† |
| Medulla | 0.21 (0.15–0.27) | 0.26 (0.24–0.31)* | 0.27 (0.25–0.30)* | 0.32 (0.25–0.41)* |
| Total | 0.83 (0.62–0.99) | 1.26 (1.10–1.36)*† | 1.38 (1.25–1.49)*† | 1.50 (1.32–1.95)*$† |
| Sham Kidney | ||||
| Cortex | 0.71 (0.59–0.80) | 0.72 (0.59–0.82) | 0.79 (0.62–0.90) | 0.81 (0.76–0.90)*$ |
| Medulla | 0.24 (0.21–0.30) | 0.25 (0.21–0.28) | 0.26 (0.24–0.30) | 0.27 (0.24–0.30) |
| Total | 0.95 (0.80–1.10) | 0.97 (0.82–1.10) | 1.05 (0.86–1.20) | 1.09 (1.00–1.20)* |
Note.─ Data are medians with interquartile ranges in parentheses.
P<0.05 compared to baseline,
P<0.05 compared to 2 weeks,
P<0.05 compared to sham. RAS=renal artery stenosis.
Renal Hemodynamics
Renal Volume
Stenotic-kidney cortical and medullary volumes showed a progressive decrease after RAS surgery (Table 1). After 6 weeks of RAS, the cortex and medulla retained only 19.4% (from 134[120–143] to 26[24–35] mm3, P=0.0044) and 35.7% (from 70[59–78] to 25[17–34] mm3, P=0.0045) of their baseline volumes, respectively. In contrast, the volume of the contralateral-kidney cortex and medulla increased. In control mice, a small increase was observed in cortical volume by 6 weeks, and none in medullary volume (Table 1).
Renal Perfusion
In the stenotic kidney, cortical perfusion dropped 2 weeks after surgery compared to baseline, and recovered slightly thereafter. Similarly, medullary perfusion fell dramatically at 2 weeks, and subsequently recovered slightly, but remained lower compared to baseline (Table 1). No change was detected in the contralateral and sham kidneys throughout the study.
RBF
In the stenotic kidney, cortical blood flow decreased markedly 2 weeks after surgery, while after an initial dramatic fall at 2 weeks, medullary blood flow recovered slightly (Table 1). From baseline to 2 weeks, the median RBF in the whole stenotic kidney fell by about 82.0% (from 0.89[0.81–1.03] to 0.16[0.11–0.18] ml/min, P<0.0001), and then stabilized. The decreases in RBF suggested a 90–95% RAS (27). While perfusion remained unchanged, contralateral kidney RBF at 6 weeks rose by 80.7% (from 0.83[0.62–0.99] to 1.50[1.32–1.95] ml/min, P=0.0033), due to the increase in renal volume. In contrast, sham kidney RBF at 6 weeks increased only slightly.
Renal Fibrosis
Renal Fibrosis in-vivo and ex-vivo
Using the selected imaging parameters, the mouse body temperature remained unchanged during the MT scans (data not shown), and discernible contrast between the fibrotic and normal tissue was achieved. The MTR in the stenotic kidney appreciably increased compared to the contralateral kidney (Fig 2), suggesting excessive collagen deposition, especially in the outer medulla.
A good agreement between ex-vivo staining and in-vivo MT imaging was observed in regions of fibrosis and edema at 2 weeks as well as in regions of fibrosis, necrosis, and collecting system at 6 weeks (Fig 2b and E2). A good correlation was observed between MTR and fibrosis quantified from corresponding trichrome (Pearson’s r=0.9038; Spearman’s ρ=0.8107, P=0.0002) and Sirius-red (r=0.9504; ρ=0.8821, P<0.0001) stained slices (Fig 2c). Exclusion of sham kidneys from the correlation analysis decreased the association of MTR with trichrome (r=0.6855; ρ=0.3939, P=0.2600) but not Sirius-red (r=0.9069; ρ=0.9152, P=0.0002) staining.
A significant increase in the hydroxyproline content was also observed in the stenotic compared to sham kidneys (24.73[22.05–47.50] vs. 132.94[118.23–202.04] mg/ml, P<0.0001), which correlated well (r=8429; ρ=0.7607, P=0.001) with MTR (Fig 2c). Exclusion of sham kidneys abolished this association (r=0.5438; ρ=0.3091, P=0.3848).
Longitudinal Progression of Renal Fibrosis
The median MTR in the post-stenotic cortex increased markedly from baseline to 2 weeks and then stabilized (Fig 3d, Fig E3a, Table E1). Contrarily, medullary MTR initially fell slightly, but subsequently increased dramatically. Both low and high MTR values were particularly apparent at 6 weeks at the cortico-medullary boundary (Fig 3a). In the contralateral kidney, MTR at 6 weeks showed a slight decrease in cortex and medulla, whereas in sham-operated kidneys it remained unchanged (Fig 3c&d, Fig E3, Table E1).
Figure 3.
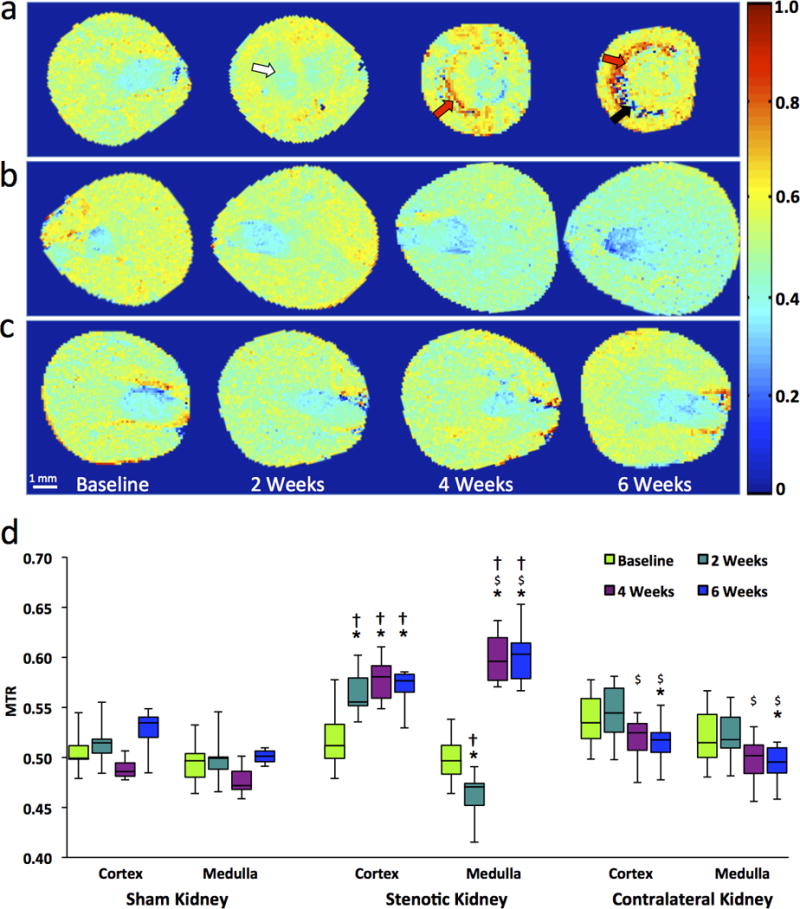
In-vivo monitoring of renal fibrosis development in mice by MT. (a–c) Representative MTR maps of the stenotic (a), contralateral (b), and sham kidney (c) at baseline and 2, 4, 6 weeks after surgery. Areas representing fibrosis, necrosis, and edema/inflammation are marked by red, black, and white arrows, respectively. (d) Box-and-whisker plots show MTR quantified in the cortex and medulla of all groups. *P<0.05 compared to baseline; $P<0.05 compared to 2 weeks; †P<0.05 compared to sham.
Interobserver bias and variation in cortical and medullary MTR quantification were minimal (<3%, Table E3), demonstrating a good reproducibility of MTR calculation as well as ROI selection.
Renal Oxygenation
A progressive rise in cortical R2* was detected by 6 weeks of RAS (Fig 4a–b, Table E2), indicating evolving hypoxia, whereas medullary R2* initially transiently fell, followed by a dramatic rise. Areas of elevated R2* agreed well with corresponding areas with elevated MTR values (Fig 3), yet seemed more extensive. A few areas with extremely low values were observed at the cortico-medullary junction in 6-week R2* and MTR maps. No changes were observed in cortex and medulla R2* in sham-operated or contralateral kidneys.
Figure 4.
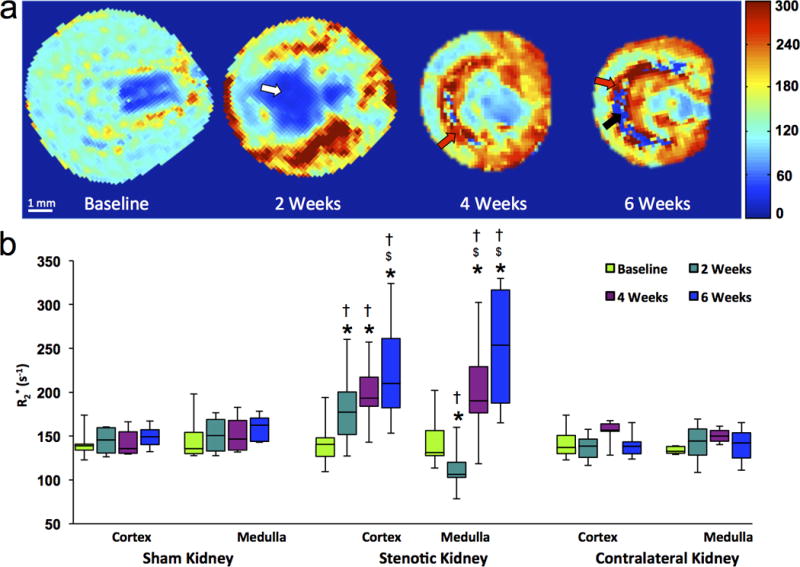
In-vivo assessment of renal oxygenation in the stenotic, contralateral and sham kidneys of mice by blood oxygen level-dependent MRI. (a) Representative R2* maps for a stenotic kidney at baseline and 2, 4, 6 weeks after induction of renal artery stenosis. Increasing levels of hypoxia are indicated by intensifying yellow and red colors. Areas representing fibrosis, possibly necrosis, and fluid (collecting system or edema) are marked by red, black, and white arrows, respectively. (b) Box-and-whisker plots show R2* quantified in the cortex and medulla of all groups. *P<0.05 compared to baseline; $P<0.05 compared to 2 weeks; †P<0.05 compared to sham.
DISCUSSION
Our study shows that MTI is capable of assessing renal fibrosis in RAS. After selecting the MT parameters suitable for collagen saturation at 16.4T, we demonstrated the feasibility of using MTI to longitudinally measure and monitor the progression of renal fibrosis in a mouse model of unilateral RAS. The fibrosis measured ex-vivo by histology and the hydroxyproline assay showed a good correlation with in-vivo MTR.
Selection of the irradiation-offset frequency is of utmost importance in MTI. With a large flip-angle, MT pulses may induce RF heating, especially at high fields (28). A high offset-frequency necessitates a larger flip-angle to maintain MT CNR, but when too low, direct saturation of free water signal causes imaging artifacts. We identified an offset-frequency at 1500Hz (~2.14ppm downfield from water) with pulse bandwidth at 300Hz yielding desirable collagen saturation with negligible perturbation on free water signal. With offset-frequency and bandwidth fixed, other MT parameters, such as pulse power and number, were determined to achieve a desirable MT CNR in-vivo. Notably, MT imaging parameters selected at an ultra-high field-strength (16.4T) may be different for clinical scanners at 1.5 or 3T; further studies are needed to evaluate the appropriate MT parameters for measurement of renal fibrosis using those scanners.
The good correlation between in-vivo MTR and ex-vivo histology further supports the notion that MTI provides reliable measurements of renal fibrosis. Both trichrome and Sirius-red staining demonstrated good correlation with the MTR map. However, excluding the sham group revealed more modest correlations, mainly due to the limited range of fibrosis among affected RAS kidneys. Nevertheless, MTR remained well-correlated with Sirius-red staining, which also correlates with renal function better than trichrome staining (4). Notably, appreciable heterogeneity was evident in both the histology and MTR maps, possibly due to inhomogeneous distribution of ECM.
RAS dramatically decreased stenotic-kidney perfusion, evidenced by arterial-spin-labeling. While not the reference standard for quantification of RBF, this method provides an index of differences in perfusion among experimental groups and time points. The longitudinal MT study then captured the progression of fibrosis over 6 weeks. While the renal cortex showed a progressive increase in MTR, a slight decrease in MTR, as well as R2* in BOLD-MRI, was observed at the cortical-medullary junction at 2 weeks. This might be attributed to development of edema secondary to inflammation and increased vascular permeability at the early stage of renal injury (29), particularly in the outer medulla (30). Subsequently, chronic inflammation promotes collagen deposition, evidenced by the marked increase in MTR at 4 and 6 weeks post-surgery. In contrast, the contralateral kidney showed a slight decrease in MTR starting at 4 weeks, possibly due to increased water content because of hyperfiltration. Indeed, the contralateral kidney showed a marked increase in RBF, which likely diluted the macromolecule pool and resulted in a slight decrease in MTR. However, these data should be interpreted with caution, because by their longitudinal nature, samples at different time-points are partially inter-dependent.
We also had an opportunity to compare changes in MTI and BOLD during the evolution of ischemic injury. Unlike MTI, which detects renal fibrosis, BOLD-MRI assesses tissue hypoxia. Indeed, regions with excessive collagen deposition in MTR maps also exhibited hypoxia in R2* maps. Interestingly, regions with hypoxia were evident earlier and more extensive than renal fibrosis, suggesting that renal hypoxia precedes fibrosis in RAS. Therefore, BOLD-MRI can provide complementary information to MTI in the evaluation of renal diseases.
There are several limitations to our study. First, although MTI successfully delineated renal fibrosis in the cortex and outer medulla, collagen deposition in inner medulla was less obvious, presumably because the abundant free water molecules in the inner medullary collecting system reduced apparent MTR values in-vivo. Second, factors other than fibrosis, such as reduced renal perfusion, might slightly enhance the observed increase in the MTR. Nevertheless, MTR values showed good correlation with independent assessment of renal fibrosis. Further studies are needed to investigate the influence of these factors and of additional ECM protein components on MT. Additional studies are also needed to determine whether hypoxic but non-fibrotic regions represent zones of more readily reversible renal injury. Moreover, despite a good agreement between in-vivo MTR maps and ex-vivo histology, some regional discrepancy might be caused by the thicker MR slices compared to histology (1mm vs. 5μm) and slight mismatch in co-registration.
PRACTICAL APPLICATIONS
MT successfully measured and longitudinally monitored the progression of renal fibrosis in mice with unilateral RAS
Its reproducibility and ability to detect and monitor renal fibrosis may provide a valuable tool for diagnosis, planning, and evaluation of therapeutic strategies for renal diseases in clinical trials. The pulse sequence used in our study is also widely available and readily implemented in clinical MR scanners. The diagnosis of other renal diseases with renal fibrosis as a biomarker, such as diabetic nephropathy (31), may also benefit from this technique.
Supplementary Material
Advances in Knowledge
The median cortical and medullary magnetization transfer ratio (MTR) in the post-stenotic kidney increased by 13.7% (P=0.0006) and 21.3% (P=0.0005), respectively, by 6 weeks after induction of renal artery stenosis (RAS).
Renal fibrosis by in-vivo magnetization transfer imaging (MTI) and ex-vivo methods showed a good correlation (Pearson’s r=0.9038 and Spearman’s ρ=0.8107, P=0.0002 vs. trichrome staining; r=0.9540 and ρ=0.8821, P<0.0001 vs. Sirius red staining; r=0.8429 and ρ=0.7607, P=0.001 vs. hydroxyproline assay), suggesting that MTI may provide a valuable tool for noninvasive measurement of renal fibrosis.
Implications for Patient Care
The ability of MTI to detect renal fibrosis may aid in the diagnosis of renal diseases and in planning therapeutic interventions in patients.
The ability of MTI in monitoring the dynamic progression of renal fibrosis may help in the evaluation of new therapeutic methods for treatment of renal diseases.
Summary Statement
MT successfully measured and longitudinally monitored the progression of renal fibrosis in mice with unilateral RAS.
Acknowledgments
Funding:
This study was partly supported by National Institutes of Health Grants DK104273, DK102325, DK73608, HL123160, HL92621 and AI-100911.
APPENDIX
Surgical Procedure
Animals were anesthetized with 1.75% isoflurane supplemented with O2 and placed in prone position on a warm (37°C) heating pad. The right lateral area between the rib cage and thigh was shaved and scrubbed with povidone-iodine solution, and the right kidney exposed by a flank incision of ~1cm. The right renal artery was then bluntly dissected from the renal vein. A 0.15mm ID×0.5mm long polyetrafluoroethylene tube (Braintree Scientific, Braintree, MA) cuff was placed around the right renal artery and tied with 10-0 nylon sutures (Surgical Specialties, Reading, PA). Kidneys were returned to their original positions and the incisions sutured. Sham surgery consisted of isolation of the renal artery without placement of a cuff.
Blood Test and Hydroxyproline Assay
The blood test and hydroxyproline assay were performed by an experienced technologist (H.T., 24 years of experience). The concentration of serum creatinine was measured using the DetectXR Creatinine Detection kit (K002-H1, Arbor Assays, Ann Arbor, MI). Blood urea nitrogen level was quantified using the QuantiChrom™ Urea Assay kit (DIUR-500, BioAssay Systems, Hayward, CA).
For hydroxyproline assay, 20mg of frozen kidney tissues were homogenized in 200μl water, and 100μl of homogenized samples transferred into glass tubes sealed with screw caps. For the calibration curve, eight tubes containing diluted Cis-4 hydorxy-D-proline (Sigma-Aldrich, Bellefonte, PA) with concentrations 0–500μg/ml were also prepared. All tubes were added 100μl 12N HCl and heated overnight at 110°C. Samples were then centrifuged at 14000 rpm for 20 min at room temperature. Supernatants were sampled and incubated with freshly made chloramine-T for 20 min at room temperature, and with fresh Ehrlich’s solution for another 20 min at 65°C. Total hydroxyproline content of samples was determined by spectrophotometry at 562nm on a plate reader (BioTek, Synergy Mx), and its concentration (mg/mL) calculated by reference to calibration curve.
Measurement of Renal Volume, Perfusion and Blood Flow by MRI
In-Vivo MRI
Mice were anesthetized with 2% isoflurane and maintained with 0.8–1.8% isoflurane in supine position. Body temperature was monitored by a physiological monitoring system (SA Instruments, Stony Brook, NY) and maintained at ~36°C by blowing hot air on the mice.
Renal volume was quantified from images acquired using a respiration-gated 3D Fast Imaging with Steady Precession sequence with the following parameters: TR 14ms; TE 2.1ms; flip-angle 20°; FOV 5.12×2.56×1.28 cm3; matrix size 256×128×64; number of averages 2. Images were acquired in the coronal plane.
Renal perfusion was measured by arterial spin labeling using a Flow-sensitive Alternating Inversion Recovery sequence with Rapid Acquisition with Relaxation Enhancement (FAIR-RARE) with the following parameters: TR 10000ms; TE 5ms; slice number 1; slice thickness 1mm; inversion slab thickness 4mm; FOV 2.56×2.56cm2; matrix size 128×72; RARE factor 72; number of averages 2. A total of 22 images were acquired with sampling delays after inversion between 40 and 2400ms.
Quantification of Renal Volume, Perfusion and Blood Flow
For the quantification of renal volume, the cortico-medullary boundary was used to define cortical and medullary ROIs. ROIs for cortex and medulla were traced on all frames where kidney was observed and the volume was calculated as
| [1] |
where N, S, and ST represent the total number of frames where ROIs were placed, the area of the ROI, and slice thickness, respectively.
Renal perfusion was quantified from the FAIR-RARE images. First, images were zero-filled from 128×72 to 256×256 in Fourier domain and reconstructed using 2D inverse Fourier transform. The magnitude images were used to generate the global (T1gl) and slice-selective (T1sl) T1 maps by pixel-wise mono-exponential fitting. The perfusion coefficient was quantified as
| [2] |
where λ is the blood/tissue partition coefficient for water (0.9ml/g) (32). is the T1 of blood, which is 2.0s at 16.4T in the 129S1 strain (26). RBF was then calculated as
| [3] |
where ρ is the tissue density of kidney (1.05g/ml) (33) and V represents renal volume calculated by equation [1].
Footnotes
This study has neither been presented at an RSNA meeting nor accepted for presentation at a future meeting.
DISCLOSURES of CONFLICTS of INTEREST
None.
References
- 1.Conway B, Hughes J. Cellular orchestrators of renal fibrosis. QJM. 2012;105(7):611–5. doi: 10.1093/qjmed/hcr235. [DOI] [PubMed] [Google Scholar]
- 2.Liu Y. Cellular and molecular mechanisms of renal fibrosis. Nat Rev Nephrol. 2011;7(12):684–96. doi: 10.1038/nrneph.2011.149. [DOI] [PMC free article] [PubMed] [Google Scholar]
- 3.Miettinen J, Helin H, Pakarinen M, Jalanko H, Lauronen J. Histopathology and biomarkers in prediction of renal function in children after kidney transplantation. Transplant Immunology. 2014;31(2):105–11. doi: 10.1016/j.trim.2014.04.006. [DOI] [PubMed] [Google Scholar]
- 4.Farris AB, Adams CD, Brousaides N, et al. Morphometric and Visual Evaluation of Fibrosis in Renal Biopsies. Journal of the American Society of Nephrology. 2010;22(1):176–86. doi: 10.1681/ASN.2009091005. [DOI] [PMC free article] [PubMed] [Google Scholar]
- 5.Hogan JJ, Mocanu M, Berns JS. The Native Kidney Biopsy: Update and Evidence for Best Practice. Clin J Am Soc Nephrol. 2015 doi: 10.2215/CJN.05750515. [DOI] [PMC free article] [PubMed] [Google Scholar]
- 6.Ebrahimi B, Rihal N, Woollard JR, Krier JD, Eirin A, Lerman LO. Assessment of renal artery stenosis using intravoxel incoherent motion diffusion-weighted magnetic resonance imaging analysis. Invest Radiol. 2014;49(10):640–6. doi: 10.1097/RLI.0000000000000066. [DOI] [PMC free article] [PubMed] [Google Scholar]
- 7.Eisenberger U, Binser T, Thoeny HC, Boesch C, Frey FJ, Vermathen P. Living renal allograft transplantation: diffusion-weighted MR imaging in longitudinal follow-up of the donated and the remaining kidney. Radiology. 2014;270(3):800–8. doi: 10.1148/radiol.13122588. [DOI] [PubMed] [Google Scholar]
- 8.Takahashi T, Wang F, Quarles CC. Current MRI techniques for the assessment of renal disease. Curr Opin Nephrol Hypertens. 2015;24(3):217–23. doi: 10.1097/MNH.0000000000000122. [DOI] [PMC free article] [PubMed] [Google Scholar]
- 9.Ebrahimi B, Textor SC, Lerman LO. Renal relevant radiology: renal functional magnetic resonance imaging. Clin J Am Soc Nephrol. 2014;9(2):395–405. doi: 10.2215/CJN.02900313. [DOI] [PMC free article] [PubMed] [Google Scholar]
- 10.Muthupillai R, Lomas DJ, Rossman PJ, Greenleaf JF, Manduca A, Ehman RL. Magnetic resonance elastography by direct visualization of propagating acoustic strain waves. Science. 1995;269(5232):1854–7. doi: 10.1126/science.7569924. [DOI] [PubMed] [Google Scholar]
- 11.Warner L, Yin M, Glaser KJ, et al. Noninvasive In vivo assessment of renal tissue elasticity during graded renal ischemia using MR elastography. Invest Radiol. 2011;46(8):509–14. doi: 10.1097/RLI.0b013e3182183a95. [DOI] [PMC free article] [PubMed] [Google Scholar]
- 12.Korsmo MJ, Ebrahimi B, Eirin A, et al. Magnetic resonance elastography noninvasively detects in vivo renal medullary fibrosis secondary to swine renal artery stenosis. Invest Radiol. 2013;48(2):61–8. doi: 10.1097/RLI.0b013e31827a4990. [DOI] [PMC free article] [PubMed] [Google Scholar]
- 13.Wolff SD, Balaban RS. Magnetization transfer imaging: practical aspects and clinical applications. Radiology. 1994;192(3):593–9. doi: 10.1148/radiology.192.3.8058919. [DOI] [PubMed] [Google Scholar]
- 14.Henkelman RM, Stanisz GJ, Graham SJ. Magnetization transfer in MRI: a review. NMR Biomed. 2001;14(2):57–64. doi: 10.1002/nbm.683. [DOI] [PubMed] [Google Scholar]
- 15.Dousset V, Grossman RI, Ramer KN, et al. Experimental allergic encephalomyelitis and multiple sclerosis: lesion characterization with magnetization transfer imaging. Radiology. 1992;182(2):483–91. doi: 10.1148/radiology.182.2.1732968. [DOI] [PubMed] [Google Scholar]
- 16.Ge Y, Grossman RI, Udupa JK, Babb JS, Kolson DL, McGowan JC. Magnetization transfer ratio histogram analysis of gray matter in relapsing-remitting multiple sclerosis. AJNR Am J Neuroradiol. 2001;22(3):470–5. [PMC free article] [PubMed] [Google Scholar]
- 17.Kuzo RS, Kormano MJ, Lipton MJ. Magnetization transfer magnetic resonance imaging of parenchymal lung disease. Invest Radiol. 1995;30(2):118–22. doi: 10.1097/00004424-199502000-00011. [DOI] [PubMed] [Google Scholar]
- 18.Adler J, Swanson SD, Schmiedlin-Ren P, et al. Magnetization transfer helps detect intestinal fibrosis in an animal model of Crohn disease. Radiology. 2011;259(1):127–35. doi: 10.1148/radiol.10091648. [DOI] [PMC free article] [PubMed] [Google Scholar]
- 19.Pazahr S, Blume I, Frei P, et al. Magnetization transfer for the assessment of bowel fibrosis in patients with Crohn’s disease: initial experience. MAGMA. 2013;26(3):291–301. doi: 10.1007/s10334-012-0355-2. [DOI] [PubMed] [Google Scholar]
- 20.Dillman JR, Swanson SD, Johnson LA, et al. Comparison of noncontrast MRI magnetization transfer and T2 -Weighted signal intensity ratios for detection of bowel wall fibrosis in a Crohn’s disease animal model. J Magn Reson Imaging. 2015;42(3):801–10. doi: 10.1002/jmri.24815. [DOI] [PubMed] [Google Scholar]
- 21.Martens MH, Lambregts DM, Papanikolaou N, et al. Magnetization transfer ratio: a potential biomarker for the assessment of postradiation fibrosis in patients with rectal cancer. Invest Radiol. 2014;49(1):29–34. doi: 10.1097/RLI.0b013e3182a3459b. [DOI] [PubMed] [Google Scholar]
- 22.Wang F, Jiang R, Takahashi K, et al. Longitudinal assessment of mouse renal injury using high-resolution anatomic and magnetization transfer MR imaging. Magn Reson Imaging. 2014;32(9):1125–32. doi: 10.1016/j.mri.2014.07.012. [DOI] [PMC free article] [PubMed] [Google Scholar]
- 23.Kline TL, Irazabal MV, Ebrahimi B, et al. Utilizing magnetization transfer imaging to investigate tissue remodeling in a murine model of autosomal dominant polycystic kidney disease. Magn Reson Med. 2015 doi: 10.1002/mrm.25701. http://www.ncbi.nlm.nih.gov/pubmed/25974140. Published May 13, 2015. Accessed December 10, 2015. [DOI] [PMC free article] [PubMed]
- 24.Ebrahimi B, Macura SI, Knudsen BE, Grande JP, Lerman LO. Fibrosis detection in renal artery stenosis mouse model using magnetization transfer MRI. Proc SPIE 8672, Medical Imaging 2013: Biomedical Applications in Molecular, Structural, and Functional Imaging, 867205 [Google Scholar]
- 25.Hartono SP, Knudsen BE, Lerman LO, Textor SC, Grande JP. Combined effect of hyperfiltration and renin angiotensin system activation on development of chronic kidney disease in diabetic db/db mice. BMC Nephrol. 2014;15:58. doi: 10.1186/1471-2369-15-58. [DOI] [PMC free article] [PubMed] [Google Scholar]
- 26.Ebrahimi B, Crane JA, Knudsen BE, Macura SI, Grande JP, Lerman LO. Evolution of cardiac and renal impairment detected by high-field cardiovascular magnetic resonance in mice with renal artery stenosis. J Cardiovasc Magn Reson. 2013;15:98. doi: 10.1186/1532-429X-15-98. [DOI] [PMC free article] [PubMed] [Google Scholar]
- 27.Rognant N, Rouvière O, Janier M, et al. Hemodynamic Responses to Acute and Gradual Renal Artery Stenosis in Pigs. American Journal of Hypertension. 2010;23(11):1216–9. doi: 10.1038/ajh.2010.147. [DOI] [PubMed] [Google Scholar]
- 28.Bernstein MA, Huston J, 3rd, Ward HA. Imaging artifacts at 3.0T. J Magn Reson Imaging. 2006;24(4):735–46. doi: 10.1002/jmri.20698. [DOI] [PubMed] [Google Scholar]
- 29.Sutton TA, Fisher CJ, Molitoris BA. Microvascular endothelial injury and dysfunction during ischemic acute renal failure. Kidney Int. 2002;62(5):1539–49. doi: 10.1046/j.1523-1755.2002.00631.x. [DOI] [PubMed] [Google Scholar]
- 30.Chade AR, Zhu XY, Grande JP, Krier JD, Lerman A, Lerman LO. Simvastatin abates development of renal fibrosis in experimental renovascular disease. J Hypertens. 2008;26(8):1651–60. doi: 10.1097/HJH.0b013e328302833a. [DOI] [PubMed] [Google Scholar]
- 31.Fernandez-Fernandez B, Ortiz A, Gomez-Guerrero C, Egido J. Therapeutic approaches to diabetic nephropathy–beyond the RAS. Nat Rev Nephrol. 2014;10(6):325–46. doi: 10.1038/nrneph.2014.74. [DOI] [PubMed] [Google Scholar]
- 32.Rajendran R, Lew SK, Yong CX, Tan J, Wang DJ, Chuang KH. Quantitative mouse renal perfusion using arterial spin labeling. NMR Biomed. 2013;26(10):1225–32. doi: 10.1002/nbm.2939. [DOI] [PubMed] [Google Scholar]
- 33.Boutaleb S, Pouget JP, Hindorf C, et al. Impact of Mouse Model on Preclinical Dosimetry in Targeted Radionuclide Therapy. Proceedings of the IEEE. 2009;97(12):2076–85. [Google Scholar]
Associated Data
This section collects any data citations, data availability statements, or supplementary materials included in this article.