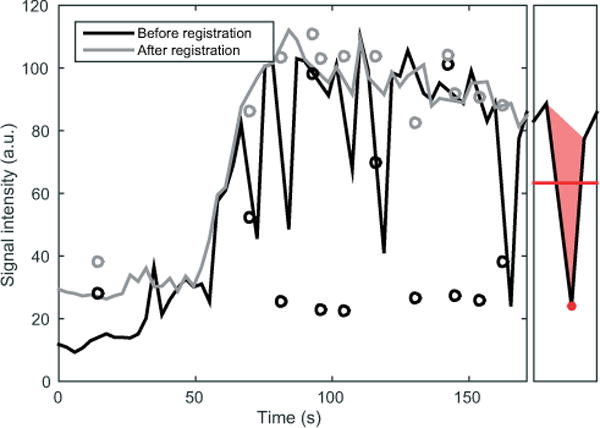
Figure 2.

Signal intensity from an intrahepatic region of interest (ROI) from a dynamic contrast-enhanced magnetic resonance imaging (DCE-MRI) examination. The left side of the plot shows the time–intensity curves for a 1-cm3 cube placed 1 cm below the dome of the liver of a patient. The black curve shows the intensity before registration, and the gray curve shows the intensity after robust registration. Phases corresponding to deep inhalations during the examination are shown as circles and are not included in the main curves. The right box illustrates the local mean signal intensity (red line) and the local spike area (solid red triangle) around a sample (red dot).
