
Figure 3.
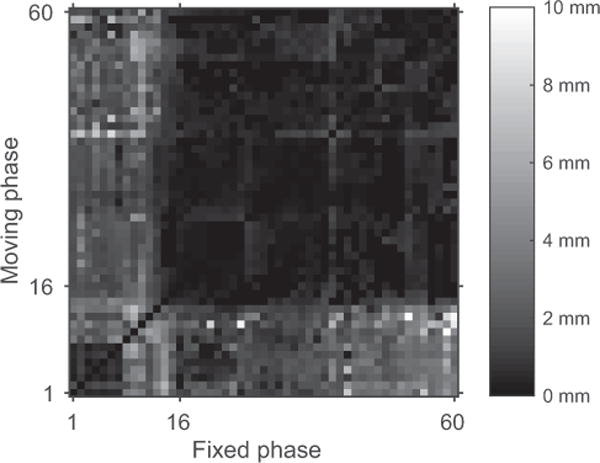
The value of ║Ei,j║F in millimeters for 1 examination following minimization of equation (4) is indicated by the color in the figure. The X-axis shows the phase index of the fixed registration phase and the Y-axis shows the index of the moving registration phase. Nine phases corresponding to deep inhalations have been omitted from the figure. Phase index 16 corresponds to the middle of the intensity ramp (τ=0). Indices <16 are precontrast phases and those >16 are postcontrast phases.