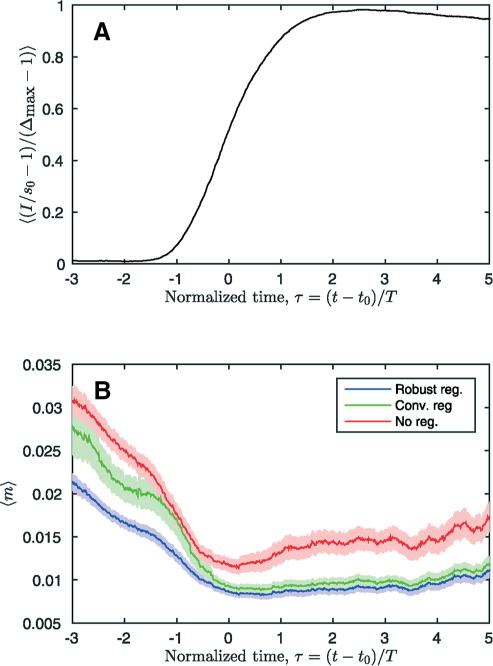
Figure 5.

The mean time–intensity curve from all examinations is shown in (A). The mean time-normalized intensity-normalized spike area, m, is shown in (B). For (B), the mean of mwas calculated for all examinations and a time window that was one normalized time unit wide. The colored bands show the 95% confidence interval for the mean.
