
Figure 10. Measurement of elongation at the single molecule level.
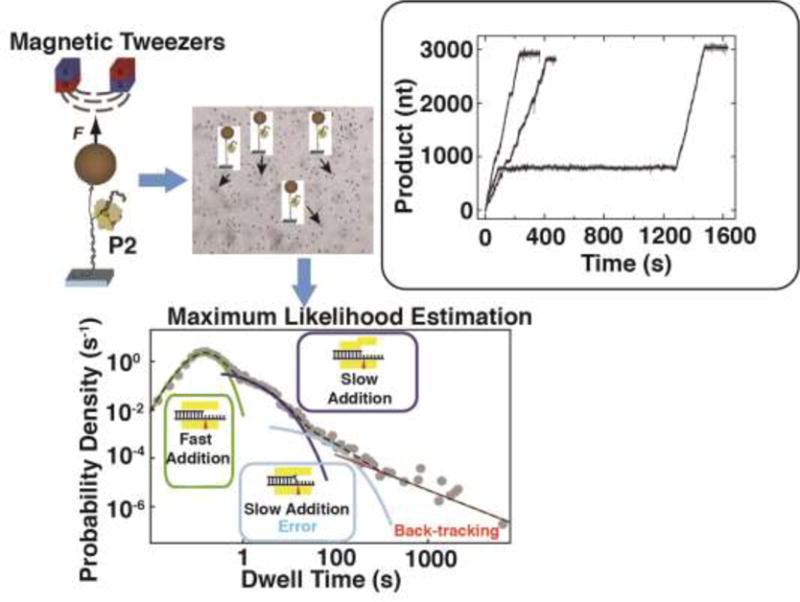
Schematic depiction of the magnetic tweezers setup to P2 mediated transcription (top left panel). Array of multiple tweezers setup in a homogeneous magnetic field to allow data collection in a highly multiplexed fashion (top middle panel). The setup comprises of an RNA strand that this largely in duplex form tethered to a magnetic bead at one extremity and to a surface on the other. The RNA contains a short 15-nt overhang at the 3′-end to allow transcriptional initiation in the presence of NTPs. The inset on the top right depicts three typical traces (displaying three distinct types of dynamic behaviors - no pauses, a few short pauses, fast transcription interrupted by a very long pause) that represent the increase in product length versus time due to transcription under a constant force (F) in the presence of an optimal NTP concentration. The lower panel depicts a dwell time distribution (DTD) plot displaying four regions: rapid addition without pause (a Γ-distribution), two sets of short pauses (Pause 1 and Pause 2 described by exponential distributions) and a power-law distribution representing long pauses due to back-tracking. Modified from (Dulin et al., 2015b) with permission.