
Figure 11. Kinetic view of the elongation cycle.
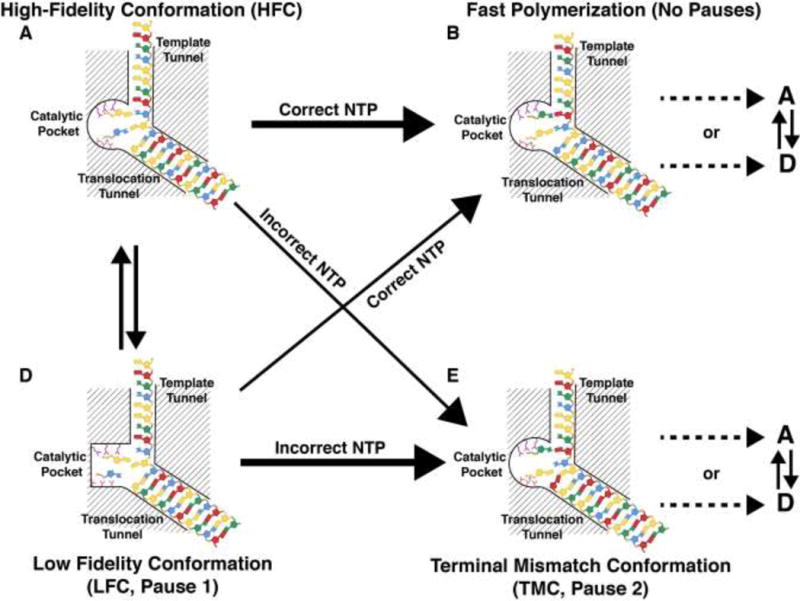
The P2 elongation complex samples two specific conformations, one with an optimal conformation of the catalytic elements (A, a High-Fidelity Conformation or HFC) that allows rapid NTP incorporation (with the correct NTP) leading to B; and a unfavorable conformation of the catalytic pocket (D, a Low Fidelity Conformation or LFC) where has a lower rate of NTP incorporation leading to pauses (Pause 1). In the presence of an incorrect nucleotide, the system enters a Terminal Mismatch Conformation (TMC) that leads to the longest pauses (Pause 2) with the slowest rate of incorporation (misincorporation). The arrows symbolize the transition between the different states with the thick arrows representing the preferred path. Adapted from Dulin et. al. (Dulin et al., 2015b).