
Figure 7. Fast timescale dynamics.
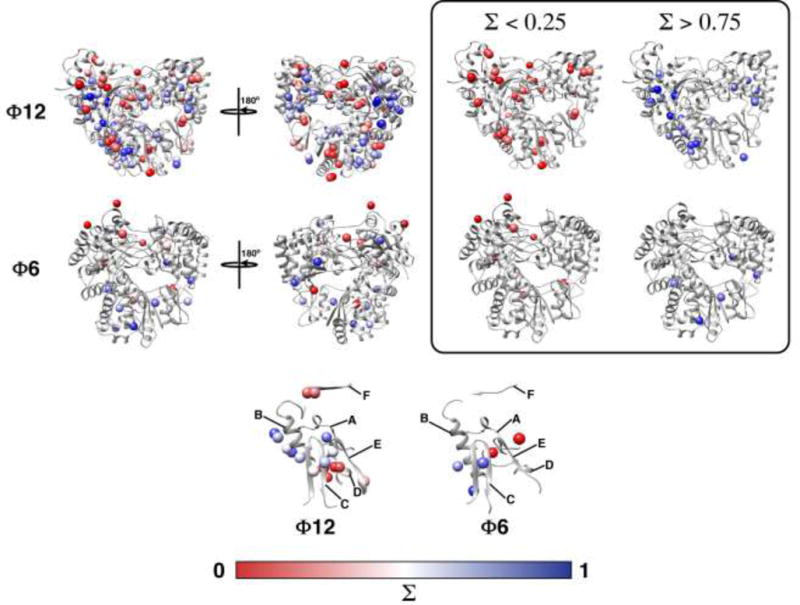
Flexibility measured from spin-relaxation utilizing the methyl positions of leucine, valine, methionine and isoleucine (δ1 only) residues in Φ12 P2 and isoleucine (δ1) for Φ6 P2. Σ values represent flexibility on the fast, nanoseconds timescale with residues with Σ = 0.5 having average flexibility for a given residue type and Σ > 0.5 and Σ < 0.5 being less and more flexible than average, respectively (Alphonse et al., 2015). The inset on the top panel shows the distribution of the least (largely distributed around the template and substrate tunnels) and most flexible positions. The bottom panel shows the flexibility of measured positions in the various conserved RdRp sequence motifs for Φ12 and Φ6 P2. Positions for motifs D and F are overall the most dynamic. The Σ values are represented using a red-to-blue gradient ranging from the most-to-least dynamic elements.