
Figure 8. Slow timescale dynamics in P2.
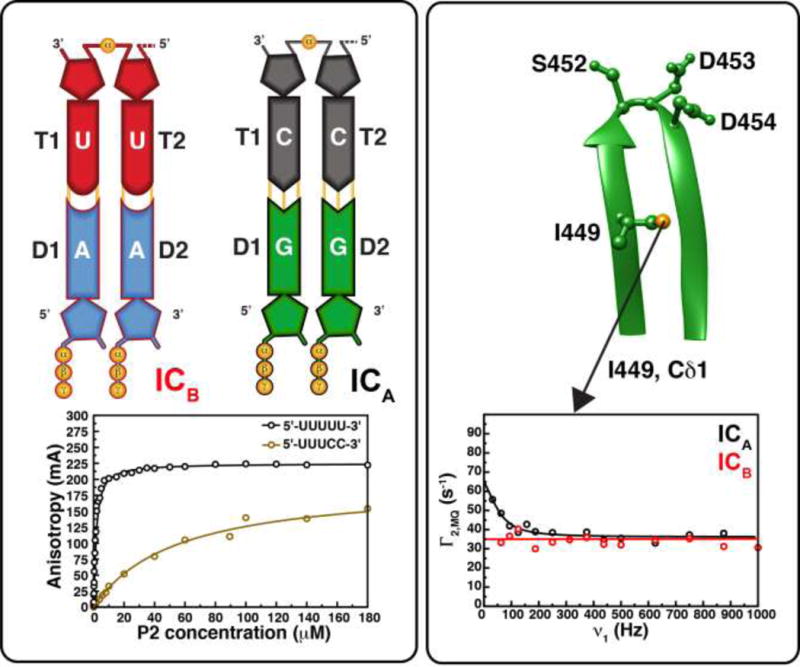
Dynamics measurements on two separate stalled initiation complexes one 5′-UUUCC-3′ with GMPCPP (ICA) and a second with a 5′-UUUUU-3′ template with AMPCPP (ICB). The 5′-UUUUU-3′ and 5′-UUUCC-3′ templates have affinities that are ~50-fold different (fluorescence anisotropy traces with increasing concentration shown on the bottom left panel) but only the latter for which the last two nucleotides correspond to the S- and M- 3′-ends, shows dynamics on a catalytically relevant timescale in its catalytic elements. Slow timescale dynamics for ICA (black trace) using the δ1 position of the Motif C residue I449 (also shown is the SDD triad) as probe is reflected in a change in the relaxation rate with field. No such dynamics is seen for ICB as reflected by the flat trace (in red) (Ren and Ghose, 2011).